East Bay Market Update for August 2020
Real Estate

Real Estate
Our team is committed to continuing to serve all your real estate needs while incorporating safety protocols to protect all of our loved ones.
Also, as your local real estate experts, we feel we must give you, our valued client, all the information you need to better understand our local real estate market. Whether you’re buying or selling, we want to make sure you have the best, most pertinent information, so we’ve put together this monthly analysis breaking down specifics about the market.
As we all navigate this together, please don’t hesitate to reach out to us with any questions or concerns. We’re here to support you.
– Jason Kerner & Stacy Hale, DRE #01361070 / 01380320
In this month’s newsletter, we cover the following:
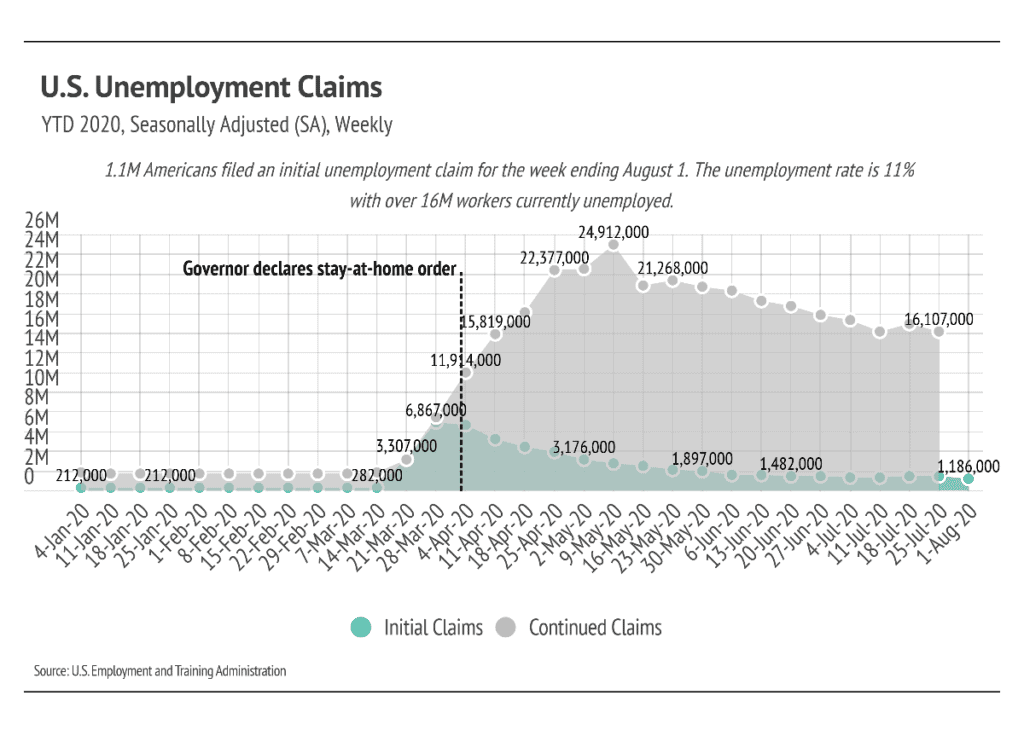
U.S. GDP fell 9.5% in 2020’s second quarter. The national unemployment rate is 11% as of August 6, 2020, and 30-year fixed mortgage rates hit historic lows in July. COVID-19 continues to spread in the United States, although new cases seem to be marginally decreasing in California and nationally.
The East Bay’s housing market experiences larger buyer demand increasing home sales and prices.
The National Bureau of Economic Research officially deemed February 2020 the most recent U.S. economic peak ending the decade-long expansionary economic cycle, which means we are in a recession until we begin another growth cycle. Unlike the last recession between 2007 and 2009, which was heavily tied to the housing market, the current COVID-induced recession is less likely to affect the housing market, at least in the short-term.
During the second quarter of 2020, home prices rose nationally while GDP—the broadest measure of goods and services produced—dropped 9.5% quarter-over-quarter. GDP and the housing market usually trend together over time. The connection between the two is quite simple: overall personal income should rise as GDP increases, thereby accumulating enough wealth to purchase a home.
Because demand for housing still outpaces supply, the negative GDP figure will likely not significantly impact housing unless it persists through the next year. Perhaps the more pertinent news regarding GDP is that the federal government offset the drop in production and spending through COVID-19 relief and stimulus measures. Specifically, the recipients of the $600 per week federal unemployment supplement, which ended July 31, largely infused that money back into the economy.

Fewer jobs amid already high unemployment rates could lead to a long road to economic recovery and evictions. In the short-term, rental properties may experience a squeeze in profits. As we continue to monitor the market, we will look for unusual upticks in rental properties coming to market, suggesting this trend is underway.
On the other hand, the pandemic has left many with more money than usual as their spending has dropped considerably. Those interested and able to buy a home are in the lowest interest rate environment in history. Freddie Mac reports that the interest rate on a 30-year fixed mortgage is at 2.88%. This is the first time the rate has dropped below 3%.
As we have discussed in previous newsletters, the affordability of a home increases (or decreases) significantly with each percentage of interest. A mortgage loan for a $900,000 home at the January 2020 rate of 3.72% costs $415 per month more than a loan at 2.88%, amounting to $150,000 over the life of the loan. As a result, we have seen a boom in refinancing, which we expect to continue for homeowners who do not wish to move. For buyers (or refinancers), this could be the lowest interest rate they will experience in their lifetime and an excellent time to execute the purchase of a home.

A note on the data: We utilize data from the California Association of Realtors®, which provides an incredibly rich data set. To bring you these reports promptly, for August, we are using June’s numbers to analyze market trends over the first half of the year.
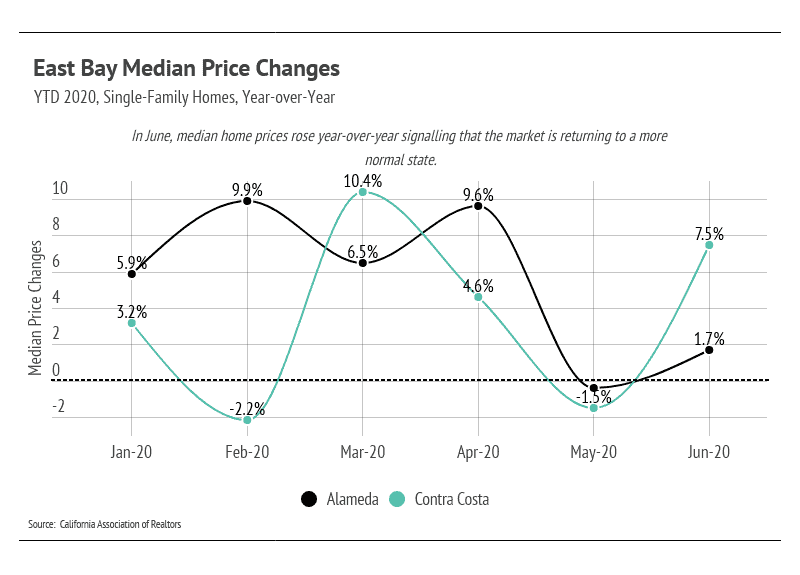
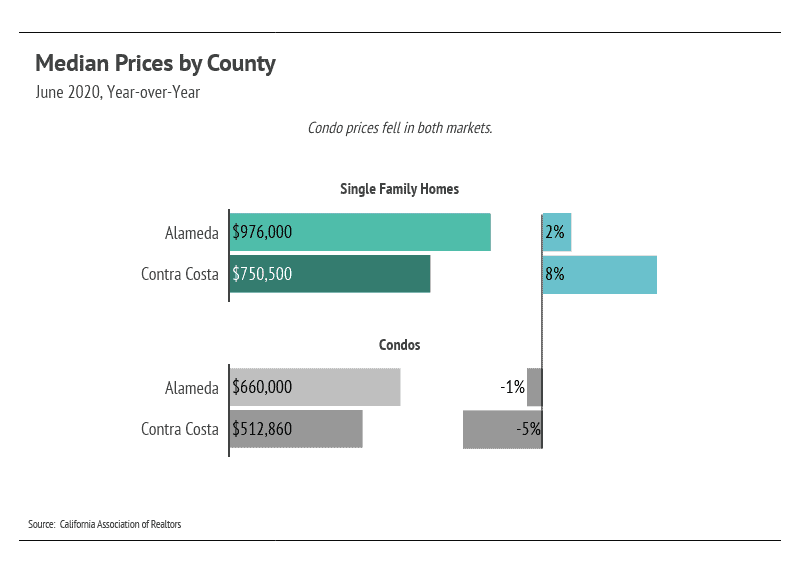
Single-family home prices climbed higher as more buyers entered the market. The condo market saw an increase in median price month-over-month and looks to be rebounding.
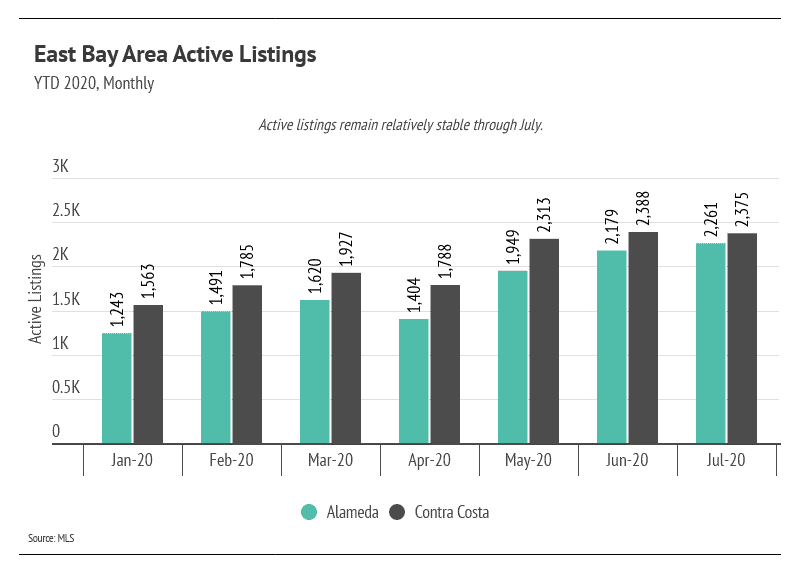
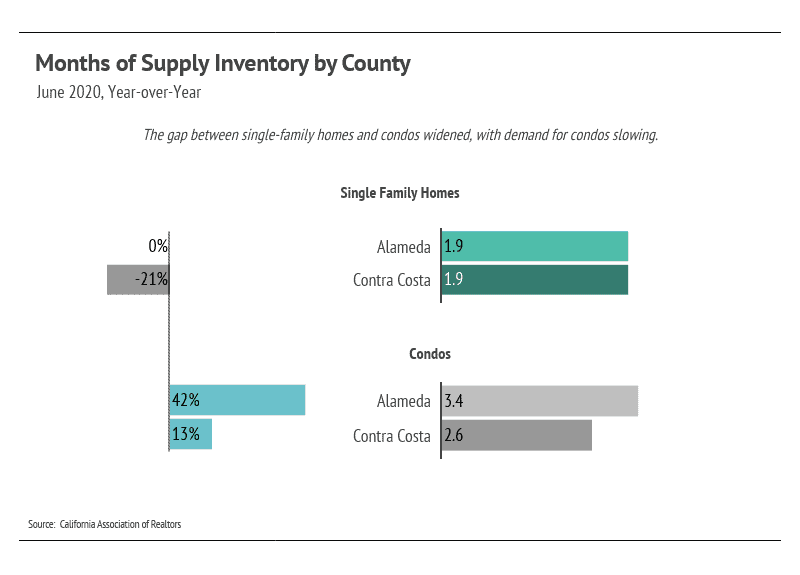
This is the measure of how many months it would take for all current homes for sale on the market to sell at the current rate of sales—as a proxy for demand. MSI has an average of three months in California. An MSI is lower than three means that buyers are dominating the market and there are relatively few sellers; a higher MSI means there are more sellers than buyers. The MSI for single-family homes fell well below the three-month mark and now heavily favors sellers once again.
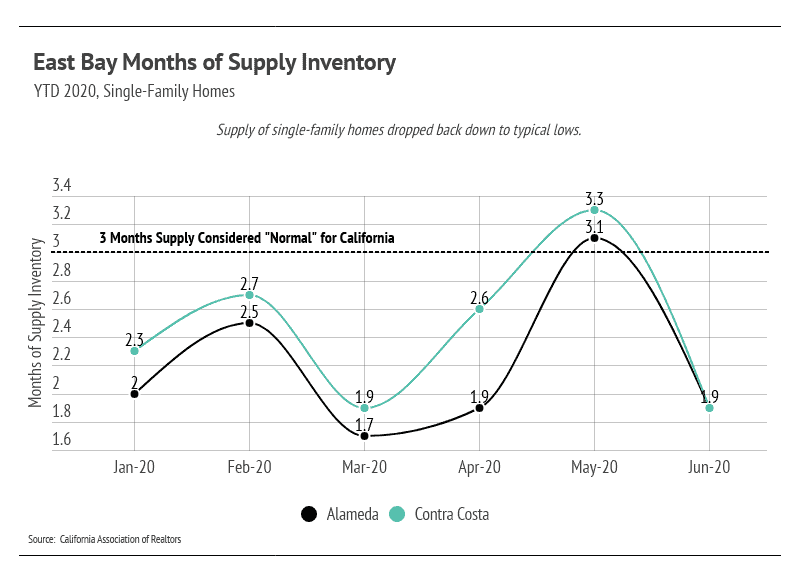
MSI rose for condos year-over-year inching above three-months of supply. As we continue to spend more time indoors, we are not surprised by the higher demand for single-family homes with larger space.
The number of homes under contract continued to trend upward, which contributed to the falling MSI and highlights the demand in the East Bay. Based on these metrics, we believe the housing market is thriving.
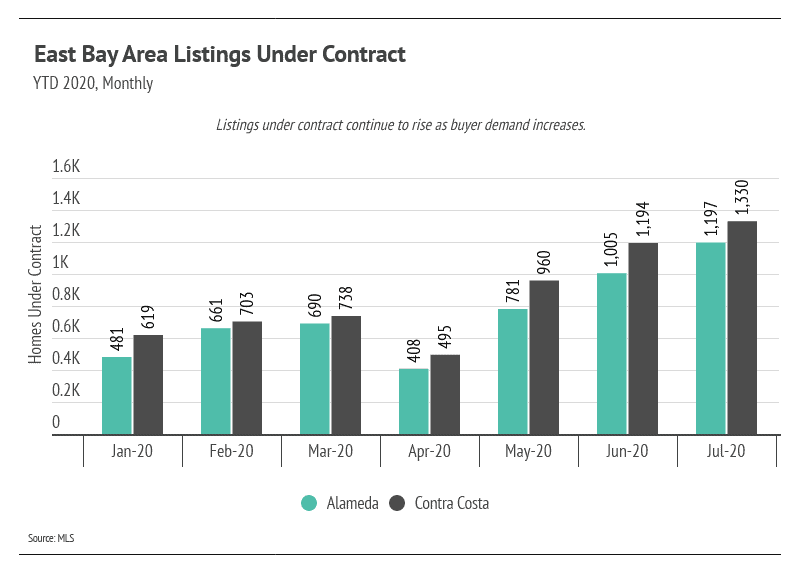
This is the result of homes under contract that closes within 30 days—every month, while also comparing them to last year’s numbers. Sales are still down 23% year-over-year for single-family homes but are on an upward path. The East Bay experienced large month-over-month gains, which is a remarkable recovery from the May low.

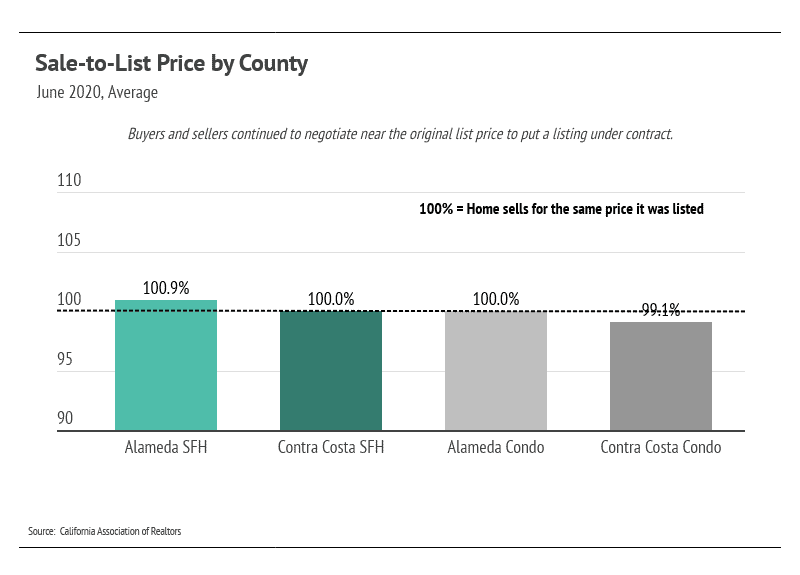
This compares the prices buyers pay to the listed prices of homes—suggest that buyers are not paying large premiums. The chart below illustrates the price that the average East Bay area buyer negotiated to put a property under contract, and whether or not it was above or below list price. In June, real estate market updates show, both single-family homes and condos sold in-line with original list prices. Single-family home and condo buyers can expect to pay around the listed price.
In summary, the difficulty that the housing market experienced in the second quarter, as evidenced by sales volume and supply, has subsided. The housing market has shown its resilience through the pandemic and remains one of the safest asset classes. Whether you are buying or selling a home, it is still incredibly important to seek out the advice of real estate experts.
Moving forward, we anticipate more sellers coming to the market. The initial seller reticence caused by COVID-19 seems to have subsided. As more supply becomes available, there could be a small price correction in the market, but we do not believe that will occur during the summer months while demand is so high.
As always, we remain committed to helping our clients achieve their current and future real estate goals. Our team of experienced professionals is happy to discuss the information we have shared in this month’s East Bay Market Update. We welcome you to contact us with any questions about the current market or to request an evaluation of your home or condo.
More on Real Estate Market Update
Stay up to date on the latest real estate trends.
You’ve got questions and we can’t wait to answer them.