The Big Story
Median home sale prices hit their highest level in a year, as the spring rally has now carried prices above where they were at this time last year.
Inventory levels have plateaued heading into the summer, with a slight month-over-month decline in June.
Existing home sales posted their strongest year-over-year gain in months, though they pulled back slightly from May's pace.
Note: You can find the charts & graphs for the Big Story at the end of the following section.
*National Association of REALTORS® data is released two months behind, so we estimate the most recent month's data when possible and appropriate.
Median sale prices are at their highest level in a year
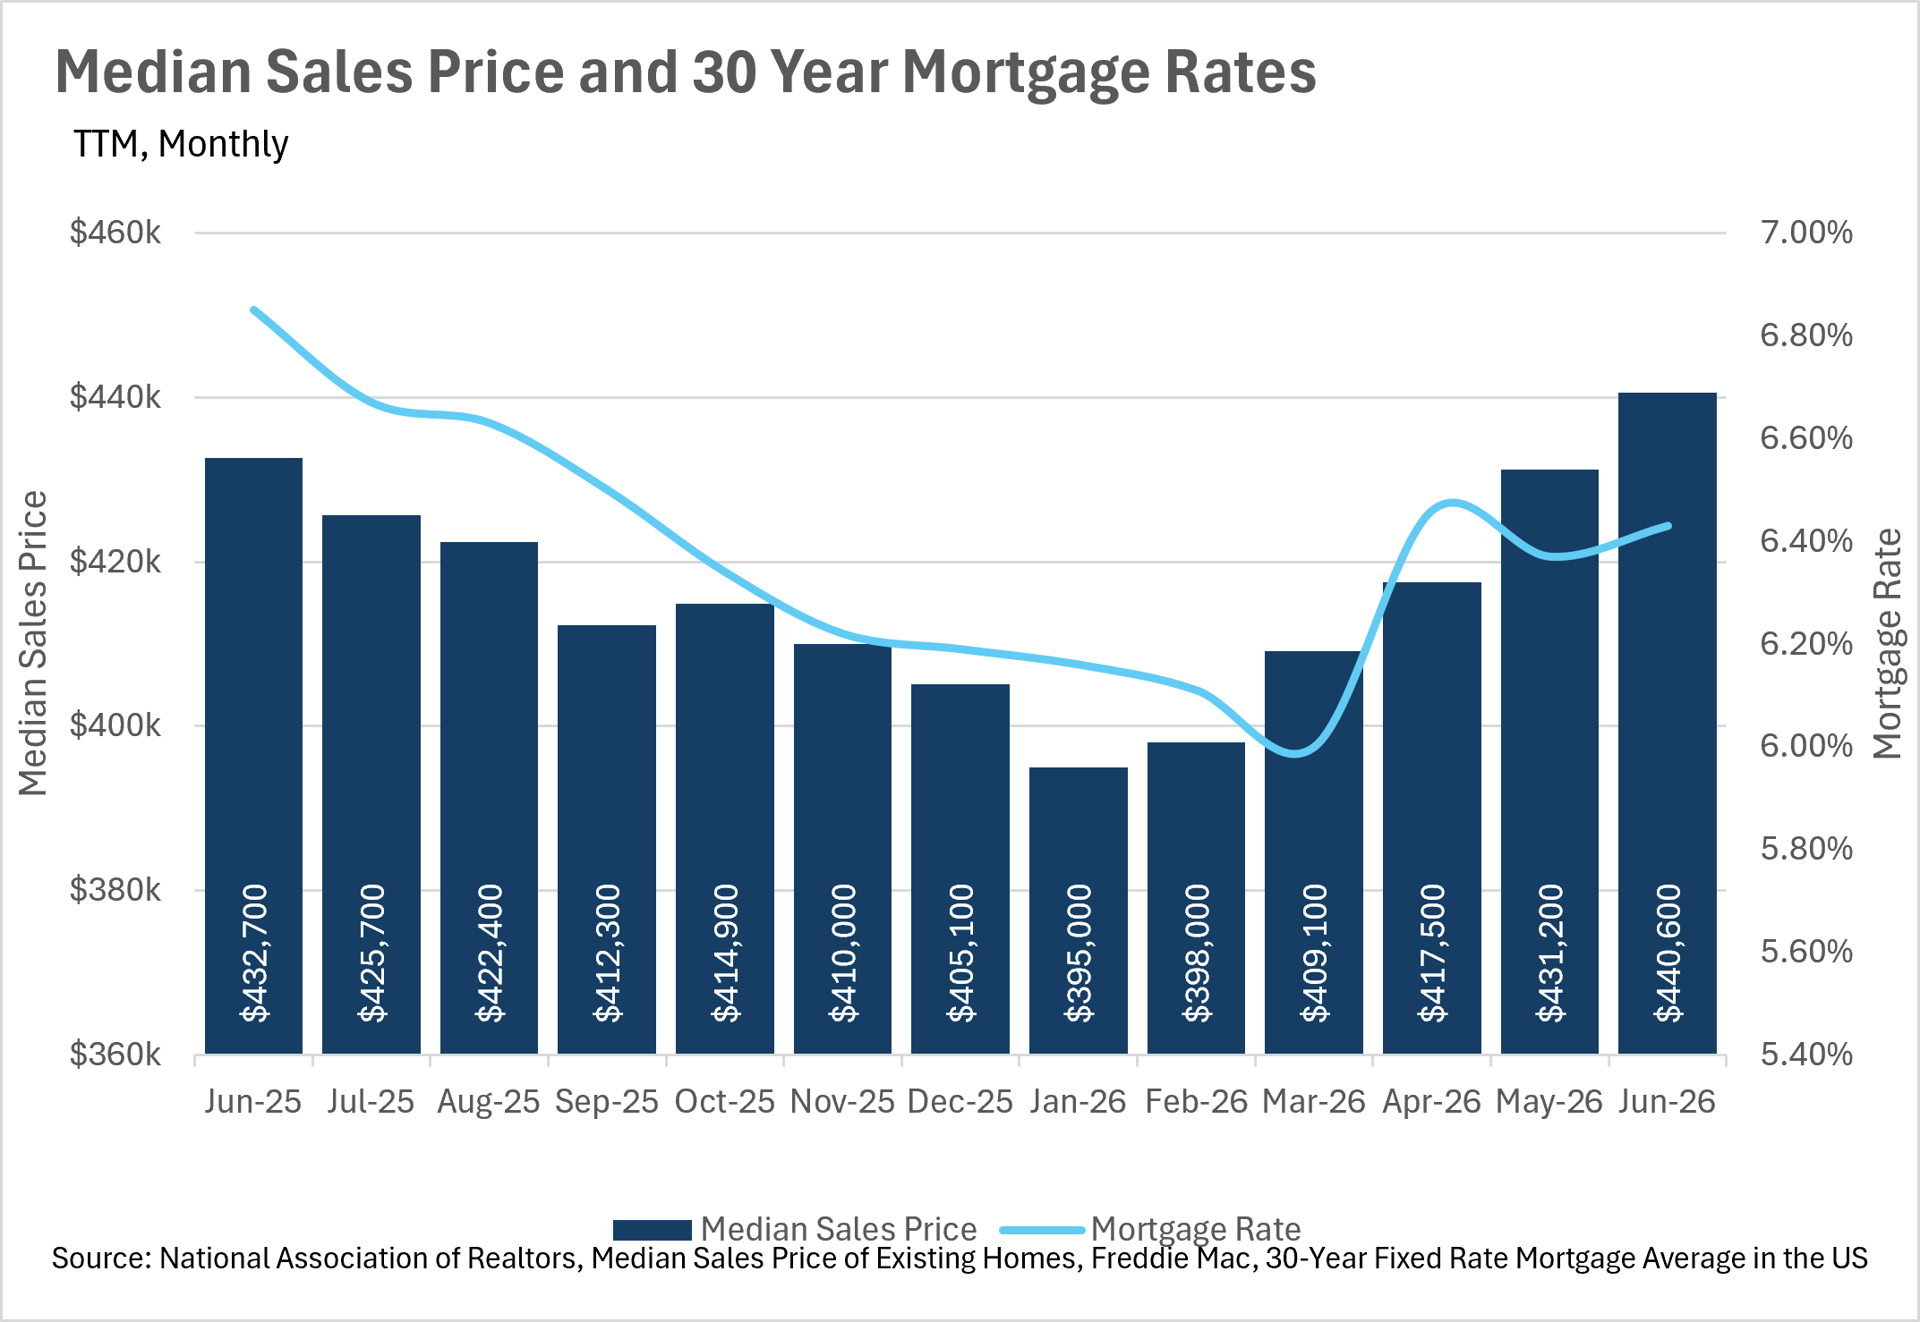
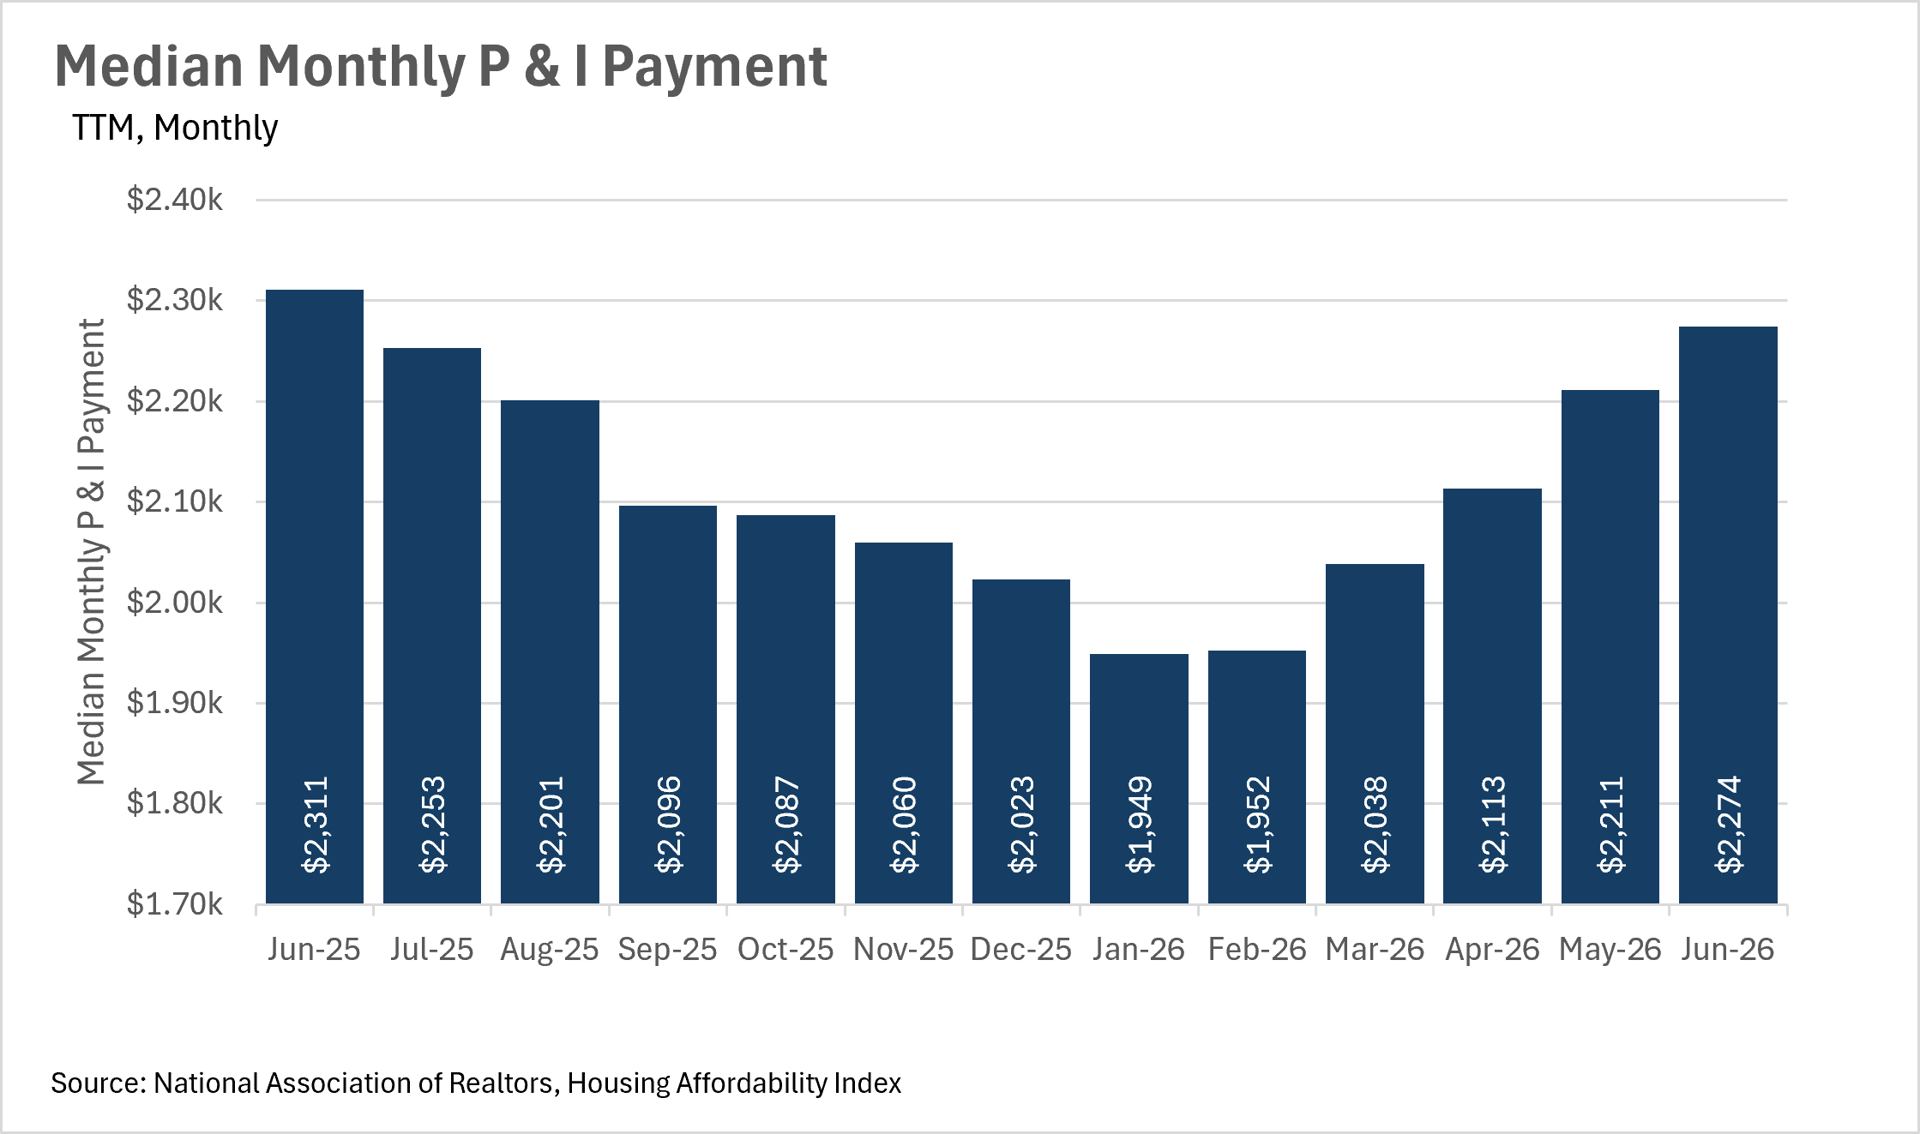
The spring rally that began back in January has officially pushed median home sale prices to their highest level in a year. In June, the median home sold for $440,600, representing a 2.18% month-over-month increase and a 1.83% year-over-year gain. This marks the fifth consecutive month of month-over-month price increases, and the median sale price has now surpassed the $432,700 peak we saw in June of last year. However, the affordability picture isn't quite as rosy as it was earlier in the year. Mortgage rates ticked up slightly to 6.43% in June, and the combination of rising prices and rates that have bounced off their March lows has pushed the median monthly P&I payment up to $2,274. While that's still 1.60% lower than the $2,311 the median homeowner was paying a year ago, the gap is shrinking fast. Back in January, the median P&I payment was $1,949, so monthly payments have risen by more than $300 in just five months. If this trend continues, the affordability gains that lower rates provided earlier in the year could be fully erased by the end of the summer.
Inventory has leveled off heading into the summer
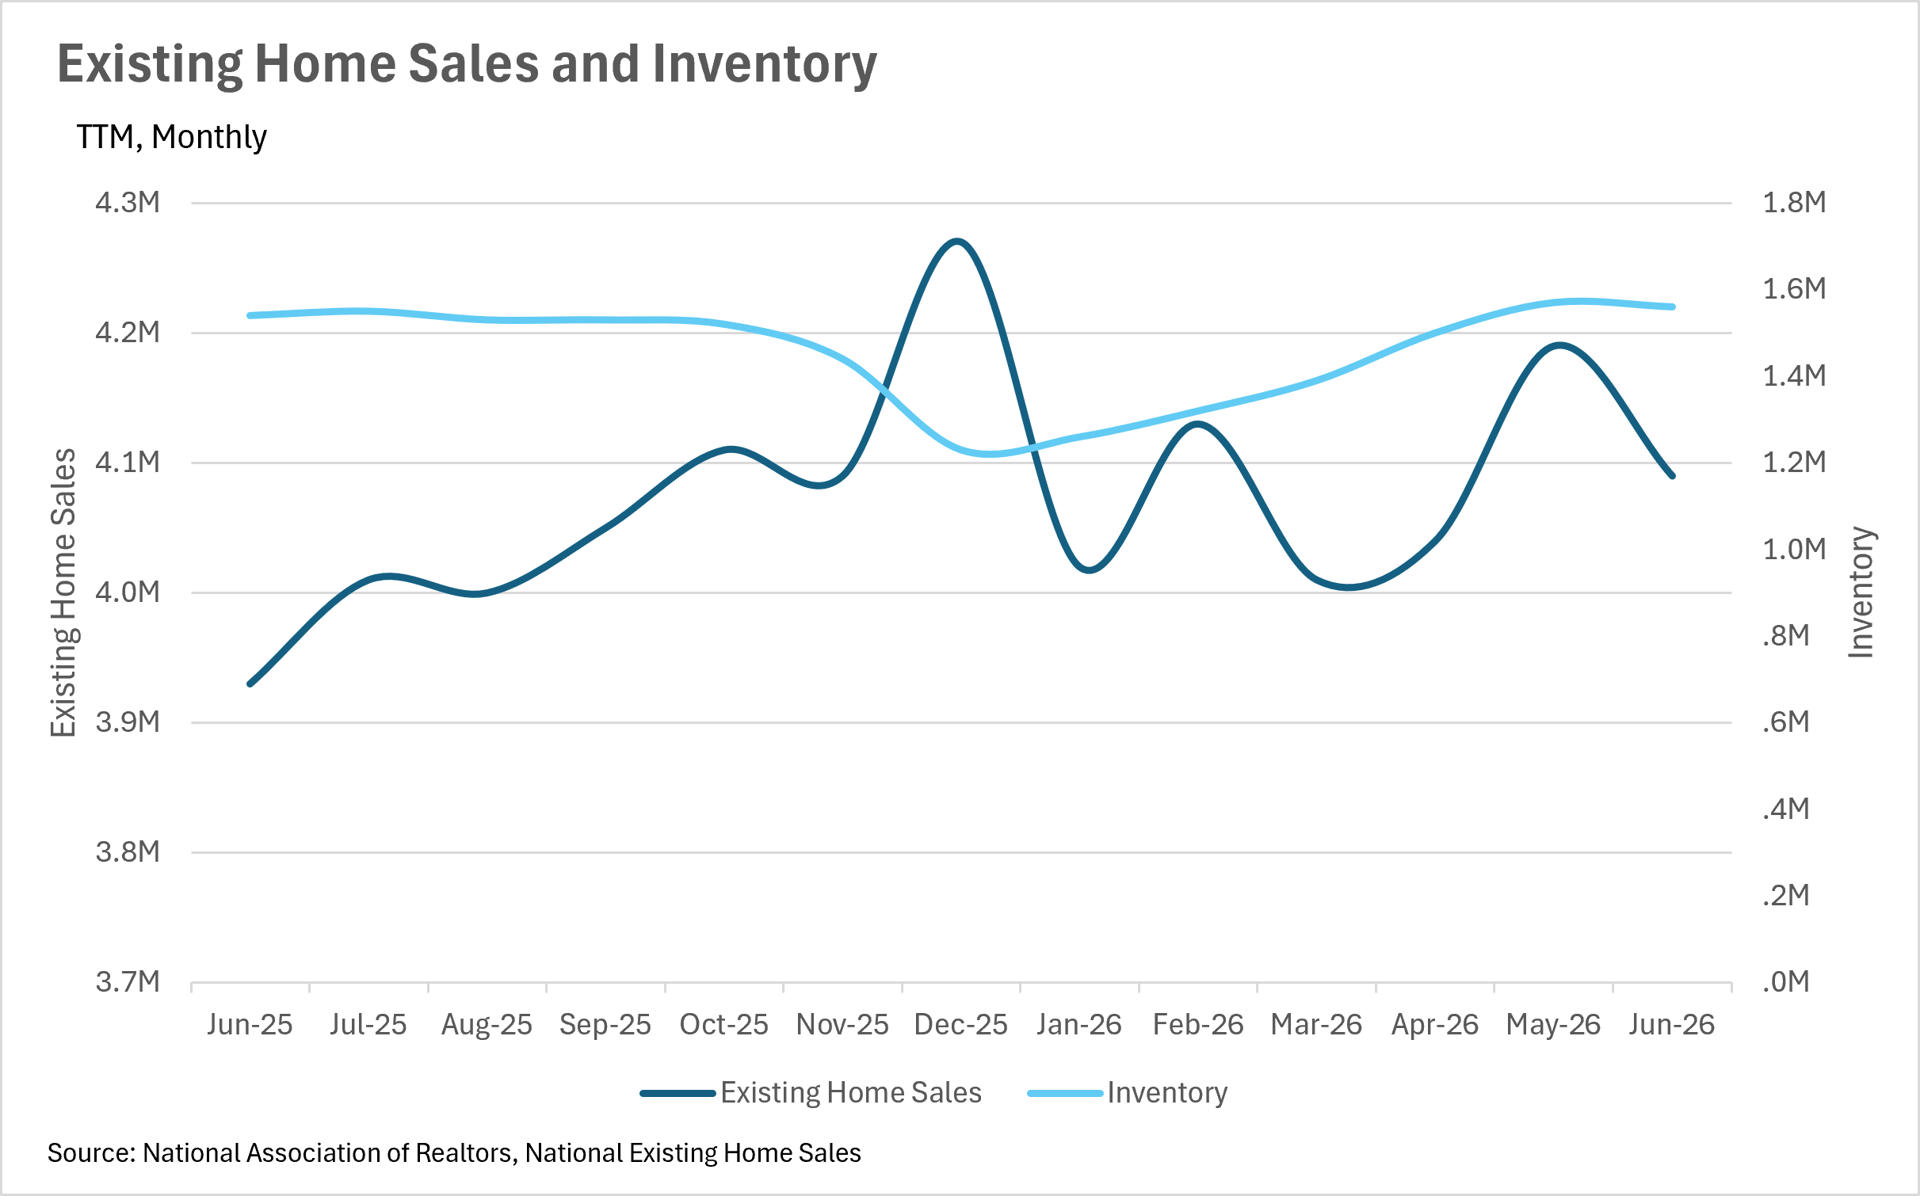
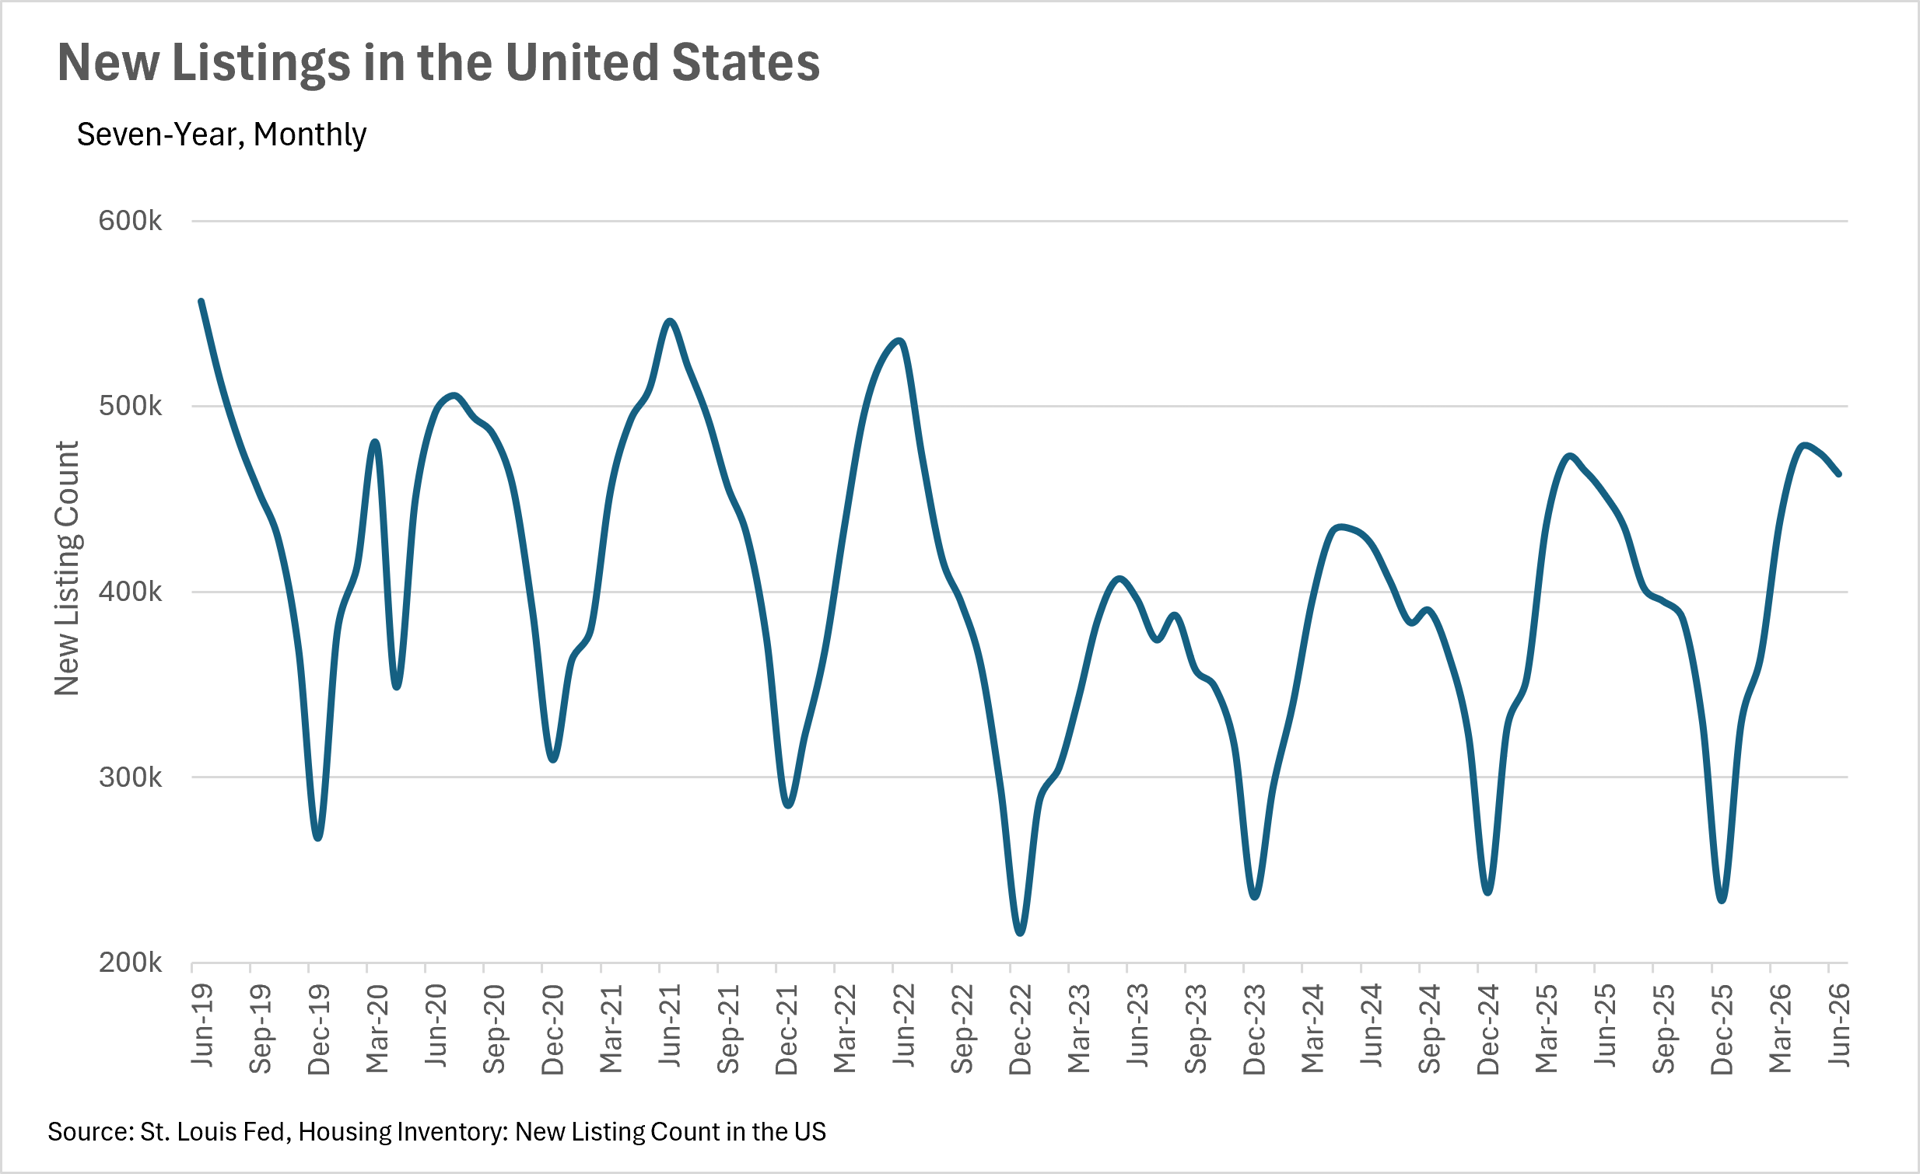
After climbing steadily from the December low of 1,230,000, inventory levels appear to have plateaued. In June, there were 1,560,000 homes available for sale, representing a slight 0.64% month-over-month decline from the 1,570,000 we saw in May, though still 1.30% higher than where we were at this time last year. On the new listings front, 463,480 new listings hit the market in June, representing a 2.45% year-over-year increase but a 2.42% month-over-month decline from May. This pullback in both inventory and new listings could signal that the spring surge of supply is beginning to taper off, which would be notable given that June and July are typically peak months for inventory. If inventory begins to decline further while demand remains strong, we could see the market tighten up heading into the back half of the summer. On the other hand, inventory levels are still roughly in line with where they were last year, so there's no reason to panic just yet.
Existing home sales are up more than 4% on a year-over-year basis
Existing home sales came in at 4,090,000 in June, representing a 4.07% year-over-year increase, the strongest year-over-year gain we've seen in quite some time. That said, sales did pull back by 2.39% from May's pace, which isn't unusual given the typical seasonality of the market. The year-over-year increase is the real headline here, as it tells us that buyers are meaningfully more active than they were at this point last year. This is likely being driven by a combination of factors: mortgage rates are still lower than they were a year ago, inventory is providing more options to choose from, and the steady march of price appreciation may be creating a sense of urgency among buyers who don't want to wait any longer. The question heading into the second half of the year is whether this momentum can be sustained. With mortgage rates hovering in the mid-6% range and monthly payments creeping higher, we could see some buyers pull back if affordability continues to erode.
Buyers are stepping up, but sellers still have the edge
When determining whether a market is a buyers' market or a sellers' market, we look to the Months of Supply Inventory (MSI) metric. The state of California has historically averaged around three months of MSI, so any area with at or around three months of MSI is considered a balanced market. Any market that has lower than three months of MSI is considered a seller's market, whereas markets with more than three months of MSI are considered buyers' markets.
Right now, the national market appears to be tilting in favor of sellers. Existing home sales are up more than 4% year-over-year, which means demand is absorbing the available supply at a healthy clip. At the same time, inventory has plateaued and even declined slightly on a month-over-month basis, which means the supply side of the equation isn't growing fast enough to offset the increase in demand. If this dynamic persists through the summer, we could see months of supply tighten further, giving sellers even more leverage. However, with monthly P&I payments rapidly approaching where they were a year ago, there's a chance that demand cools off in the coming months, which would bring the market back toward balance. As always, real estate is a highly localized asset, which is why you should check out what's going on in your local market below in the Local Lowdown!
Big Story Data
The Local Lowdown
Prices are rising across the board, with the condo market posting its strongest year-over-year gains in years.
Inventory remains nearly 27% below last year for single-family homes, keeping competition fierce among buyers.
Single-family homes are selling significantly faster than last year, with listings moving in under two weeks.
Note: You can find the charts/graphs for the Local Lowdown at the end of this section.
The condo market roars back to life
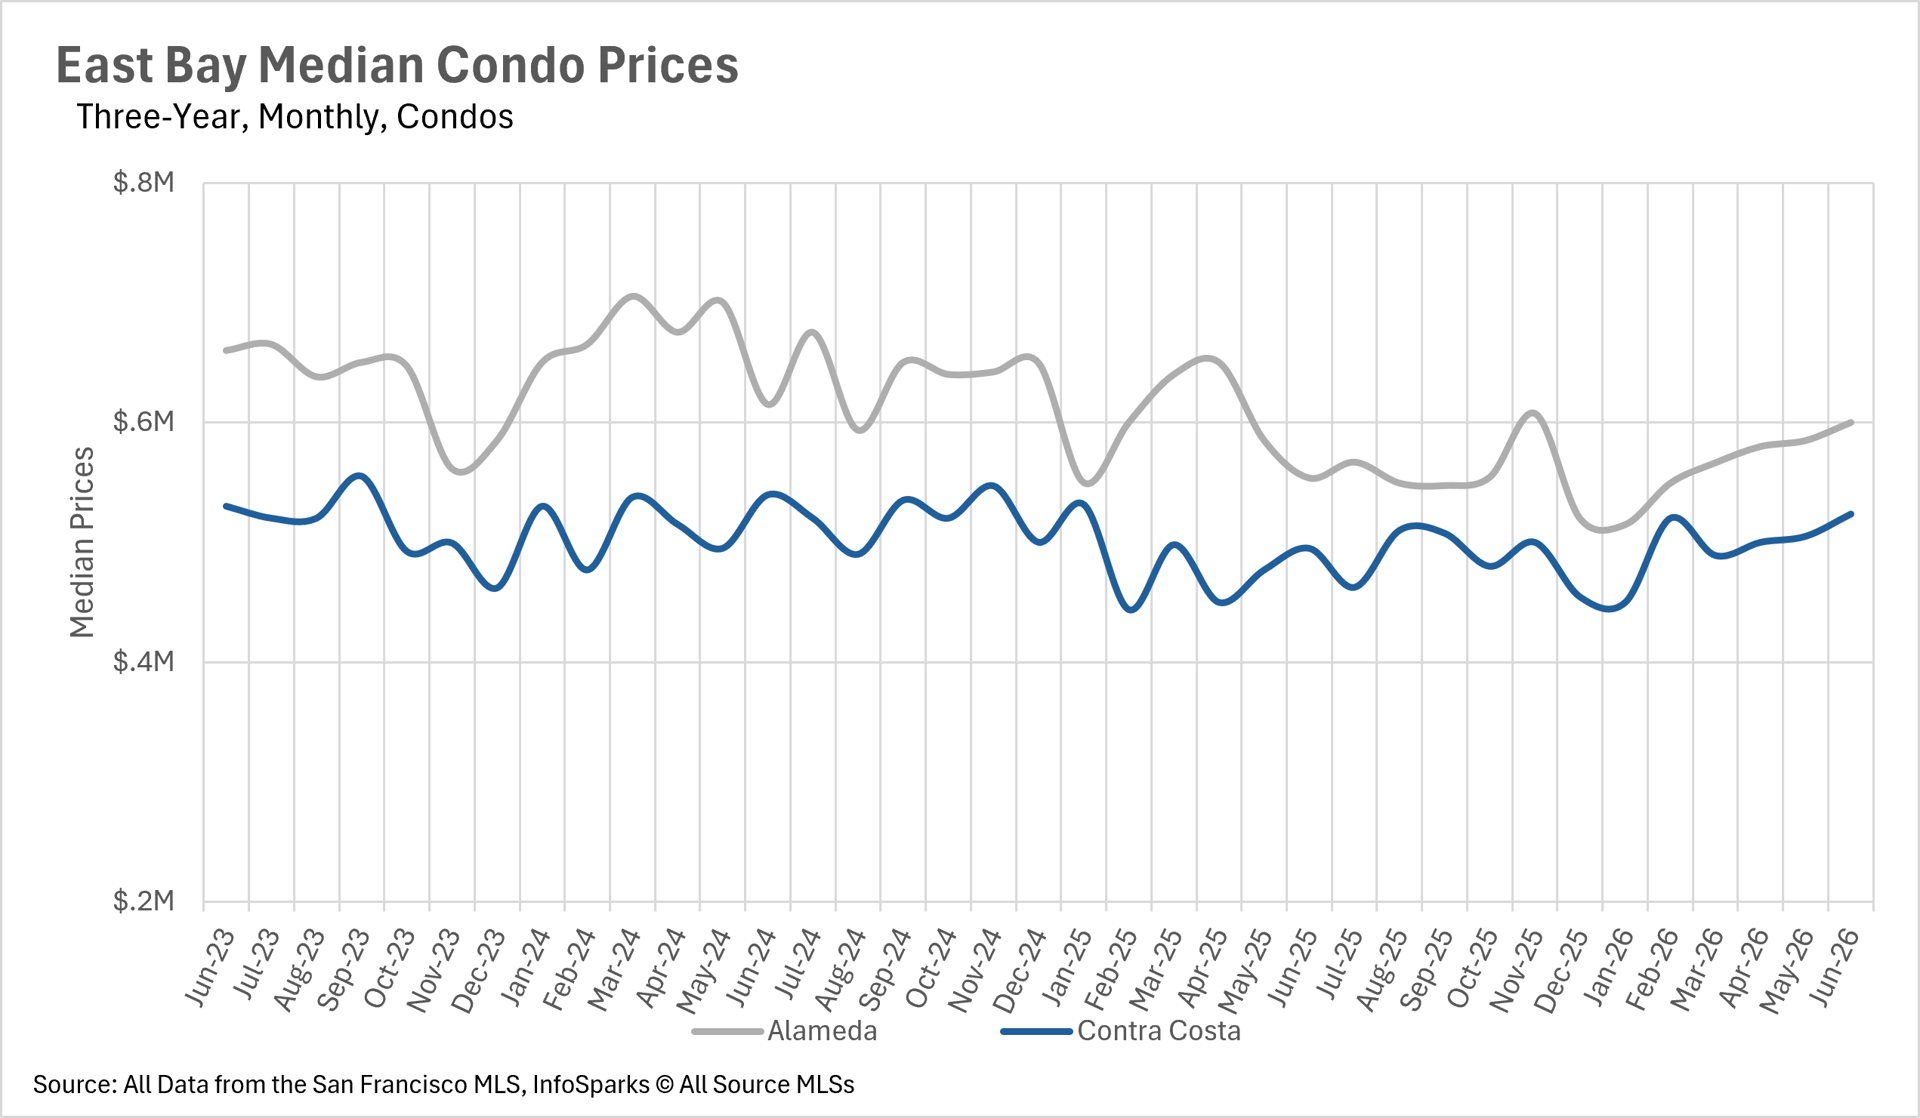
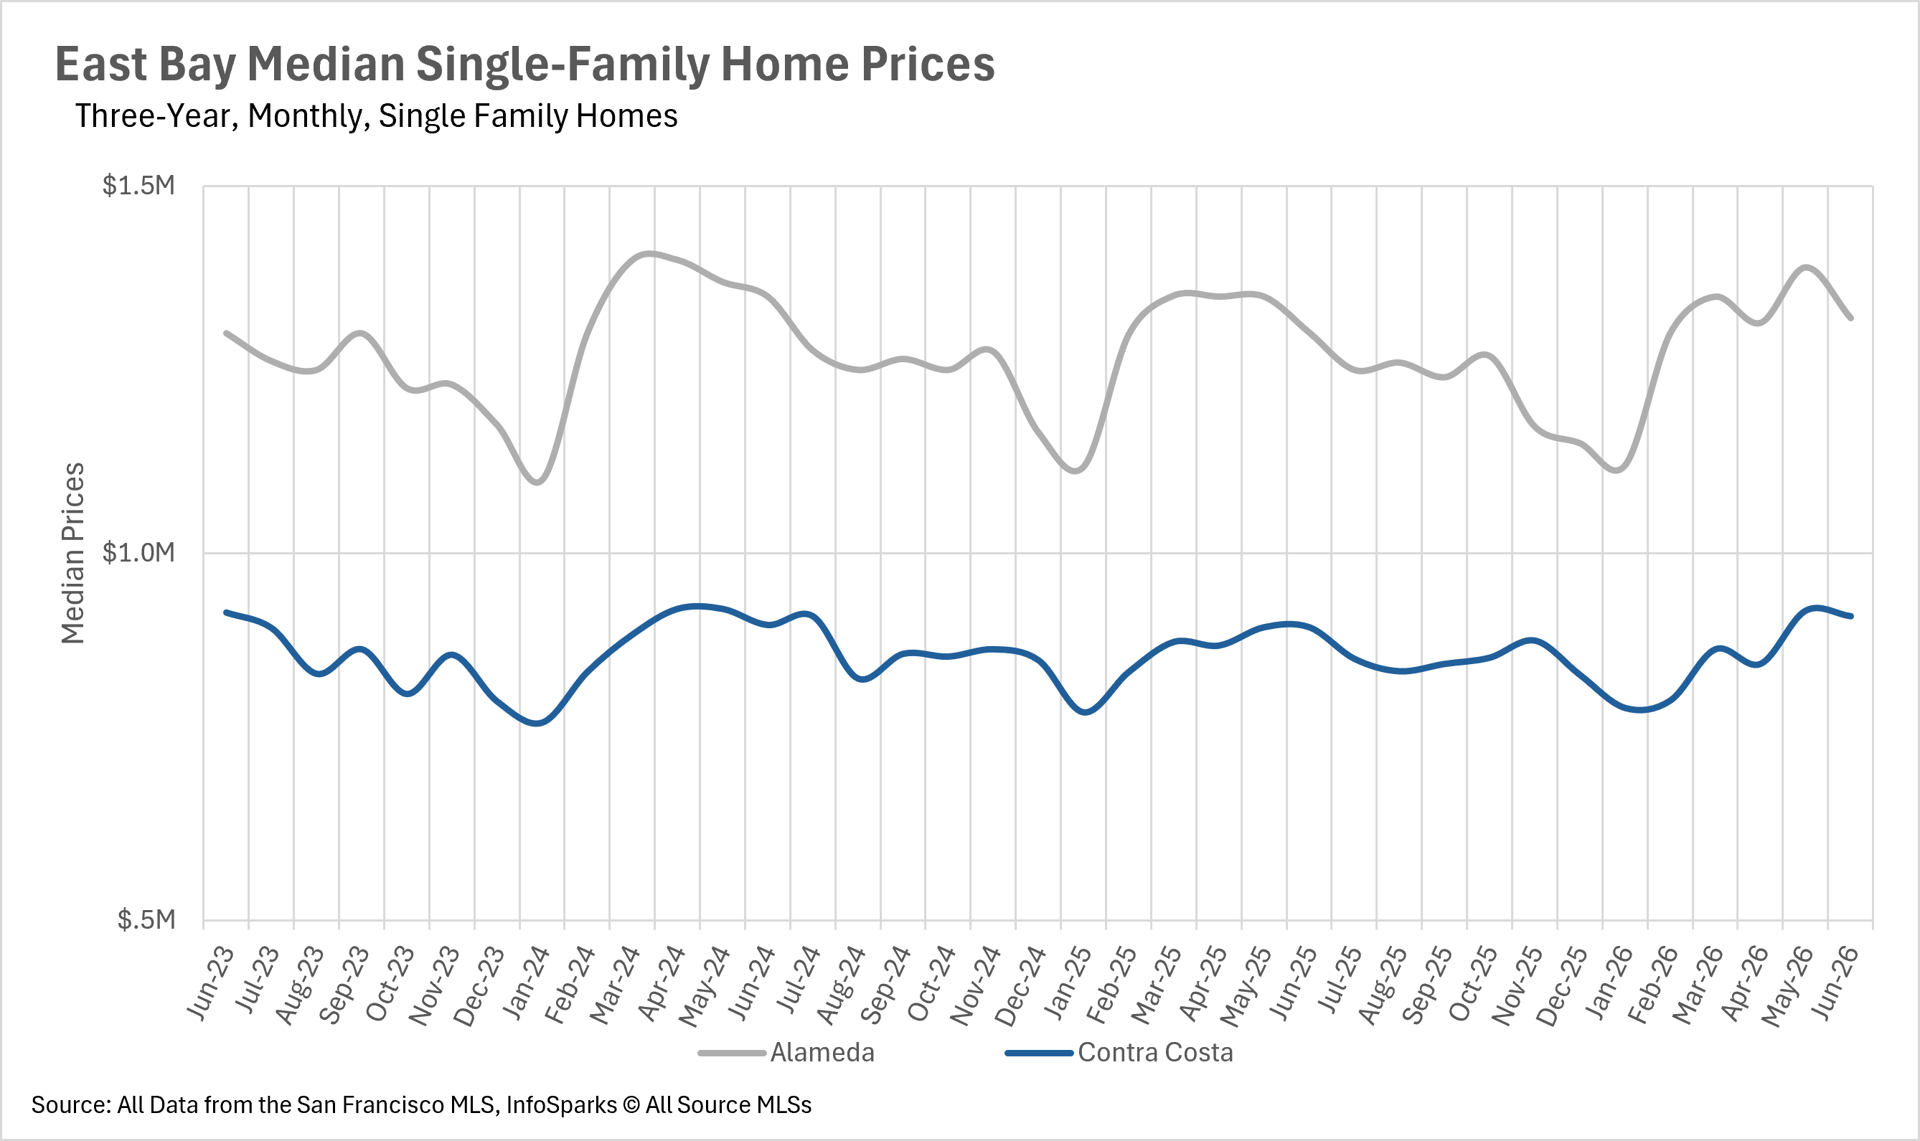
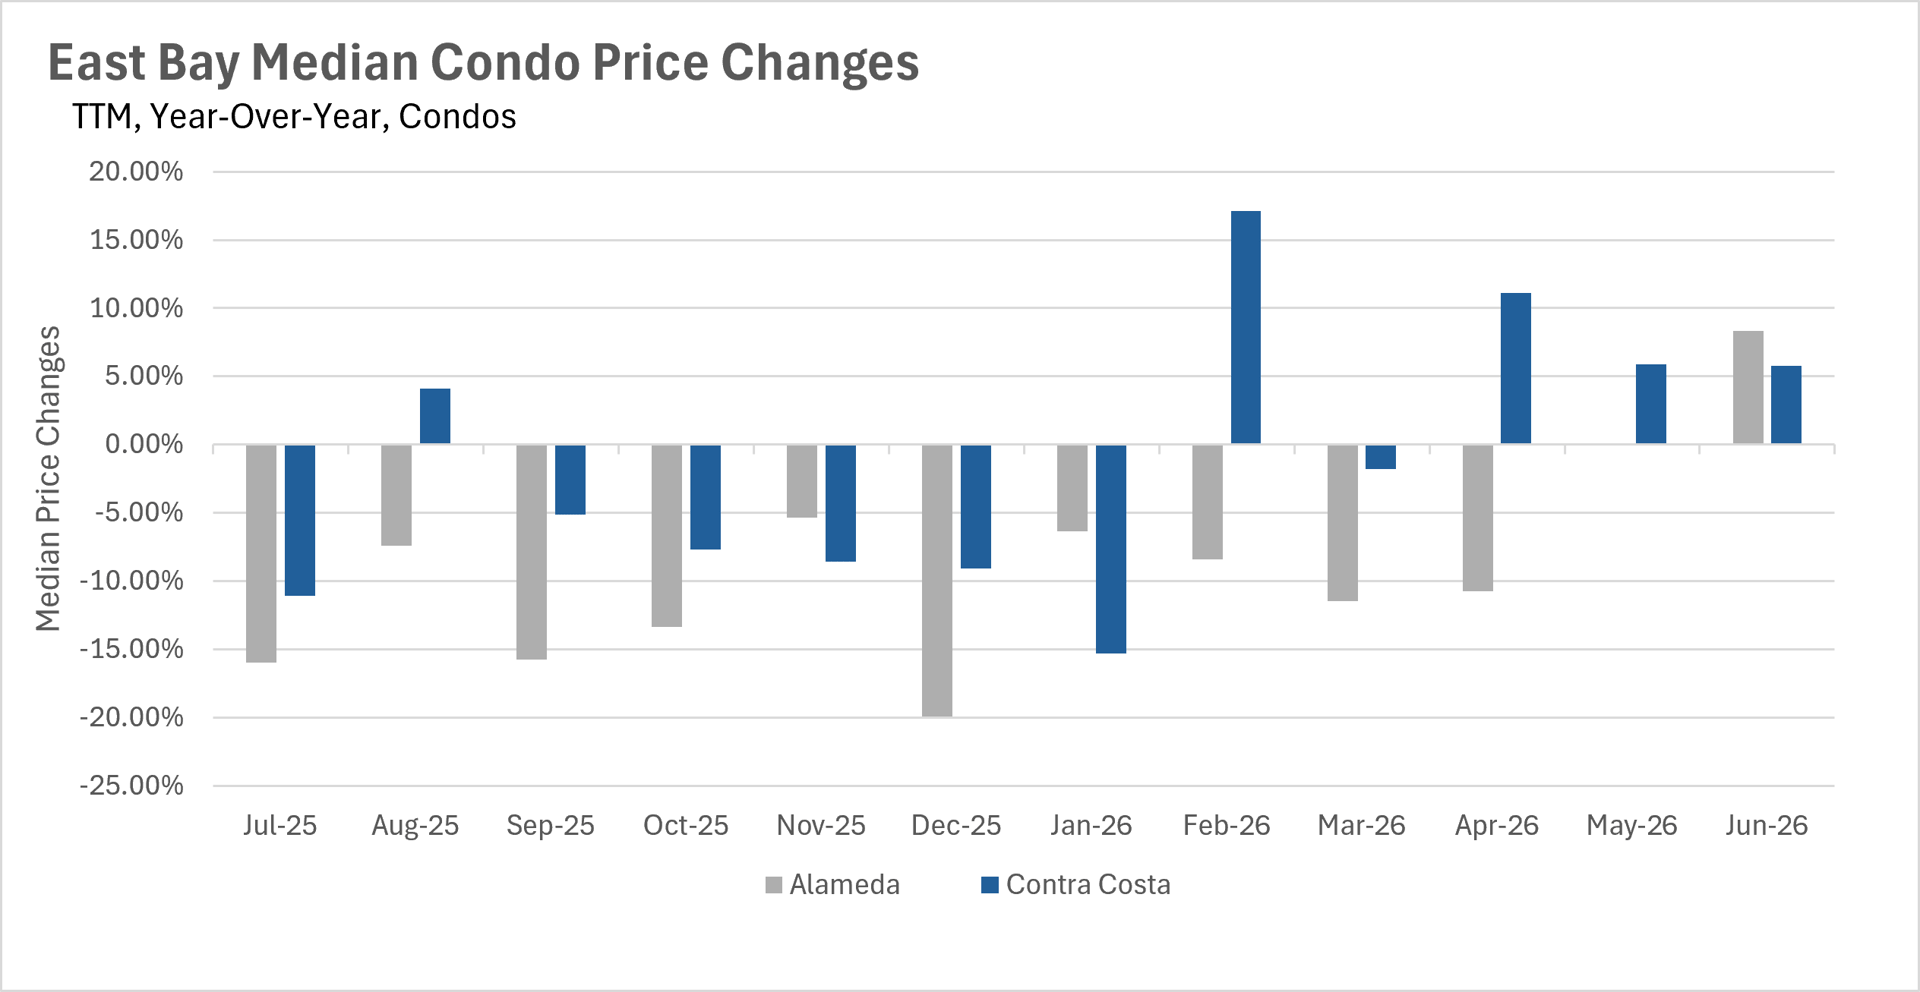
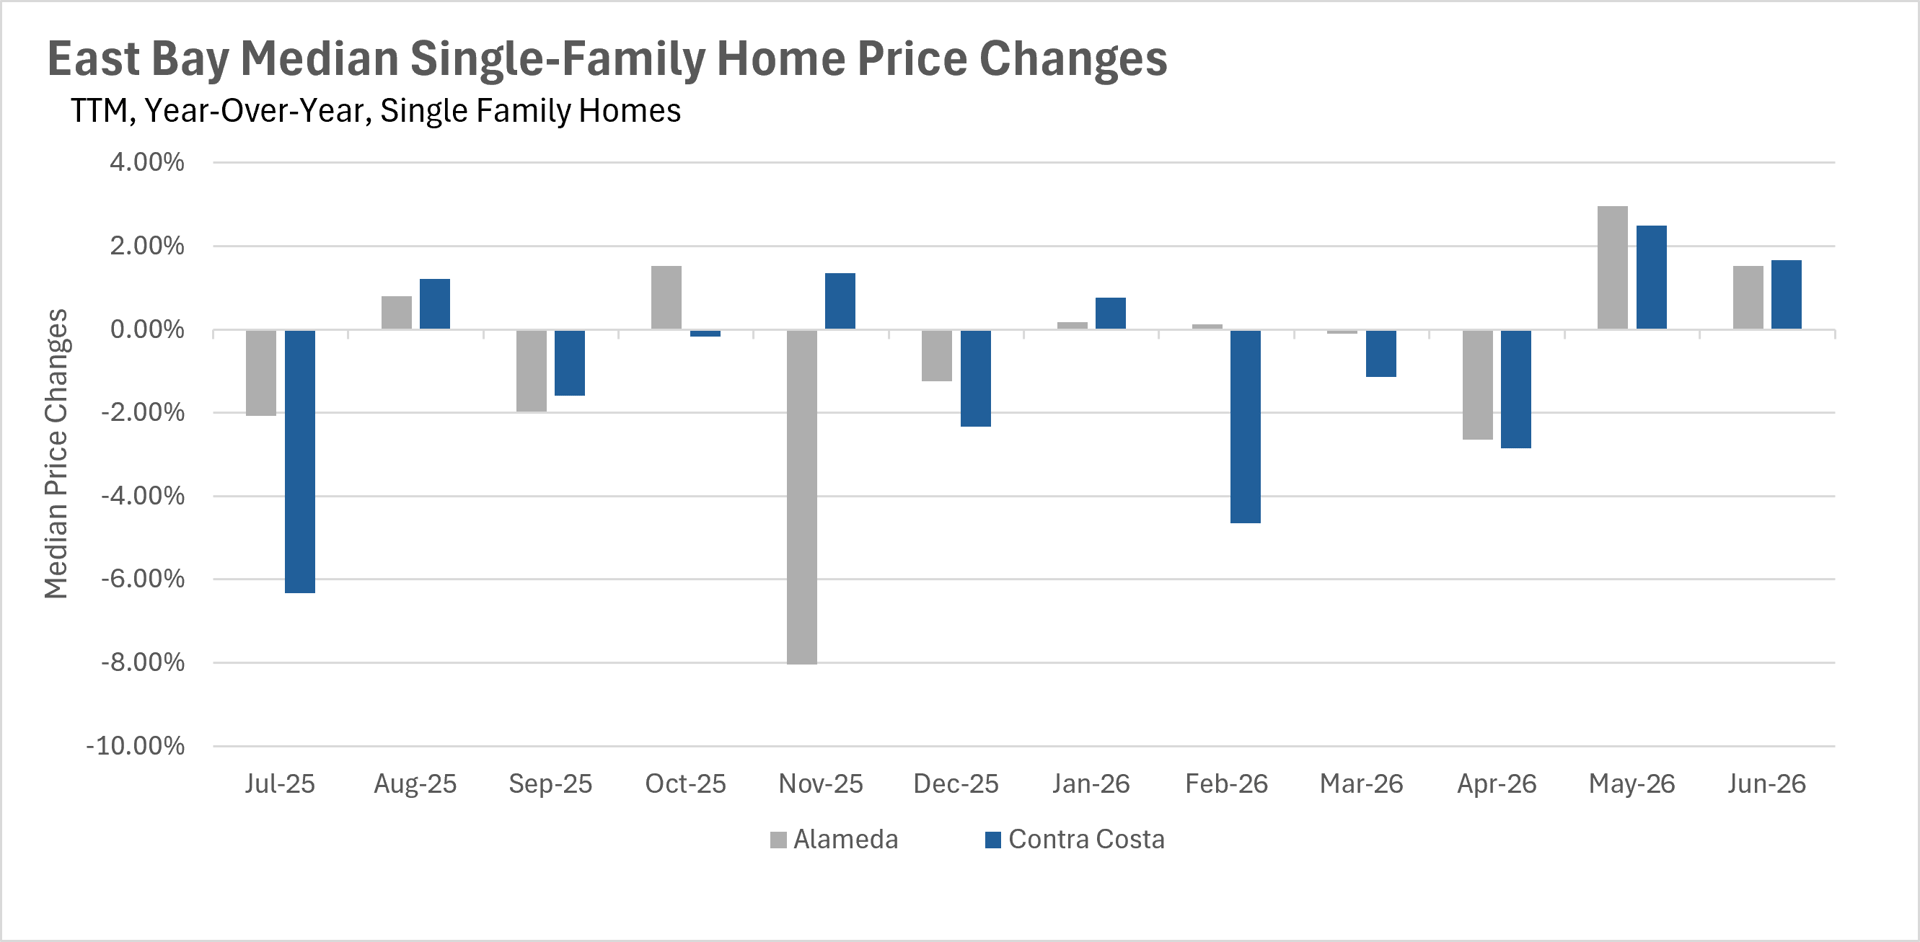
June brought even more good news for East Bay homeowners, as prices continued to climb across both the single-family and condo markets. In Alameda County, the median single-family home sold for $1,320,750, representing a 1.52% increase on a year-over-year basis. Contra Costa County saw similar gains, with the median single-family home selling for $915,000, up 1.67% compared to last year. The real story this month, however, is the remarkable turnaround in the condo market. Alameda County condos surged 8.35% year-over-year, with the median condo selling for $600,000. This is a dramatic reversal from the double-digit declines we were seeing just a few months ago. Contra Costa County condos also performed well, rising 5.76% to a median sale price of $523,500. After a prolonged period of weakness, the condo market appears to have turned the corner.
Inventory remains exceptionally tight heading into summer
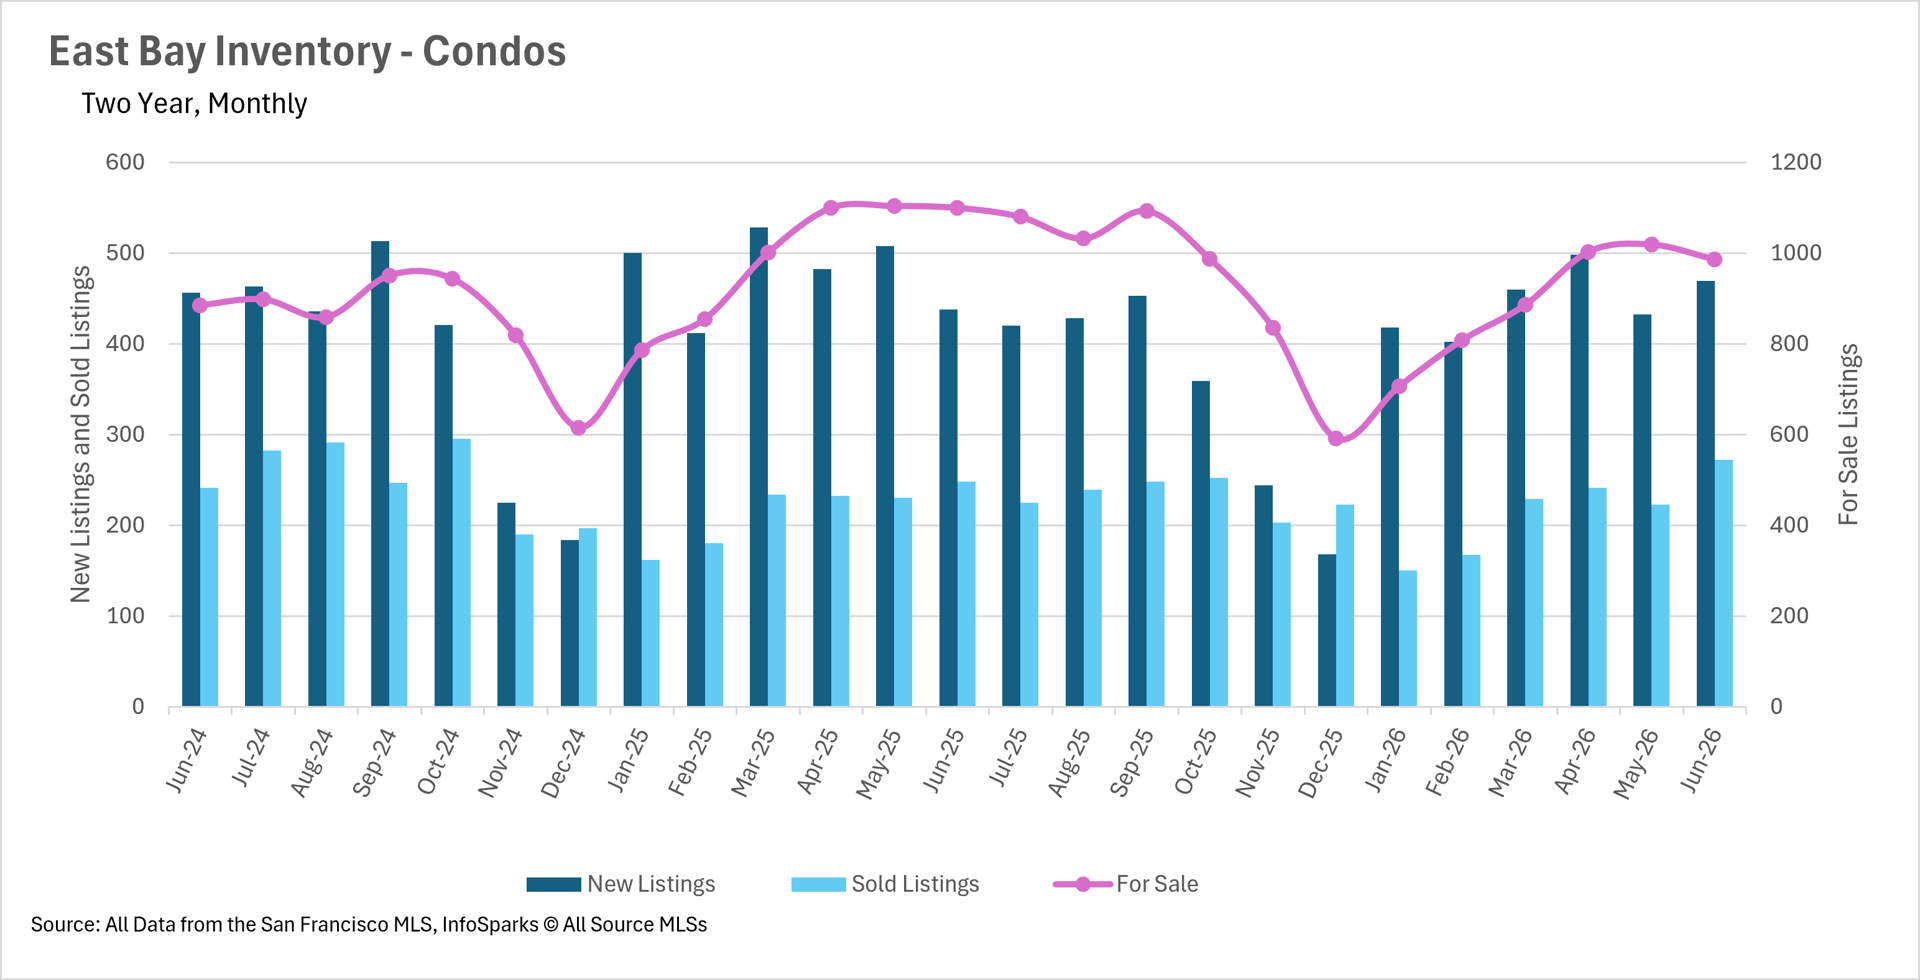
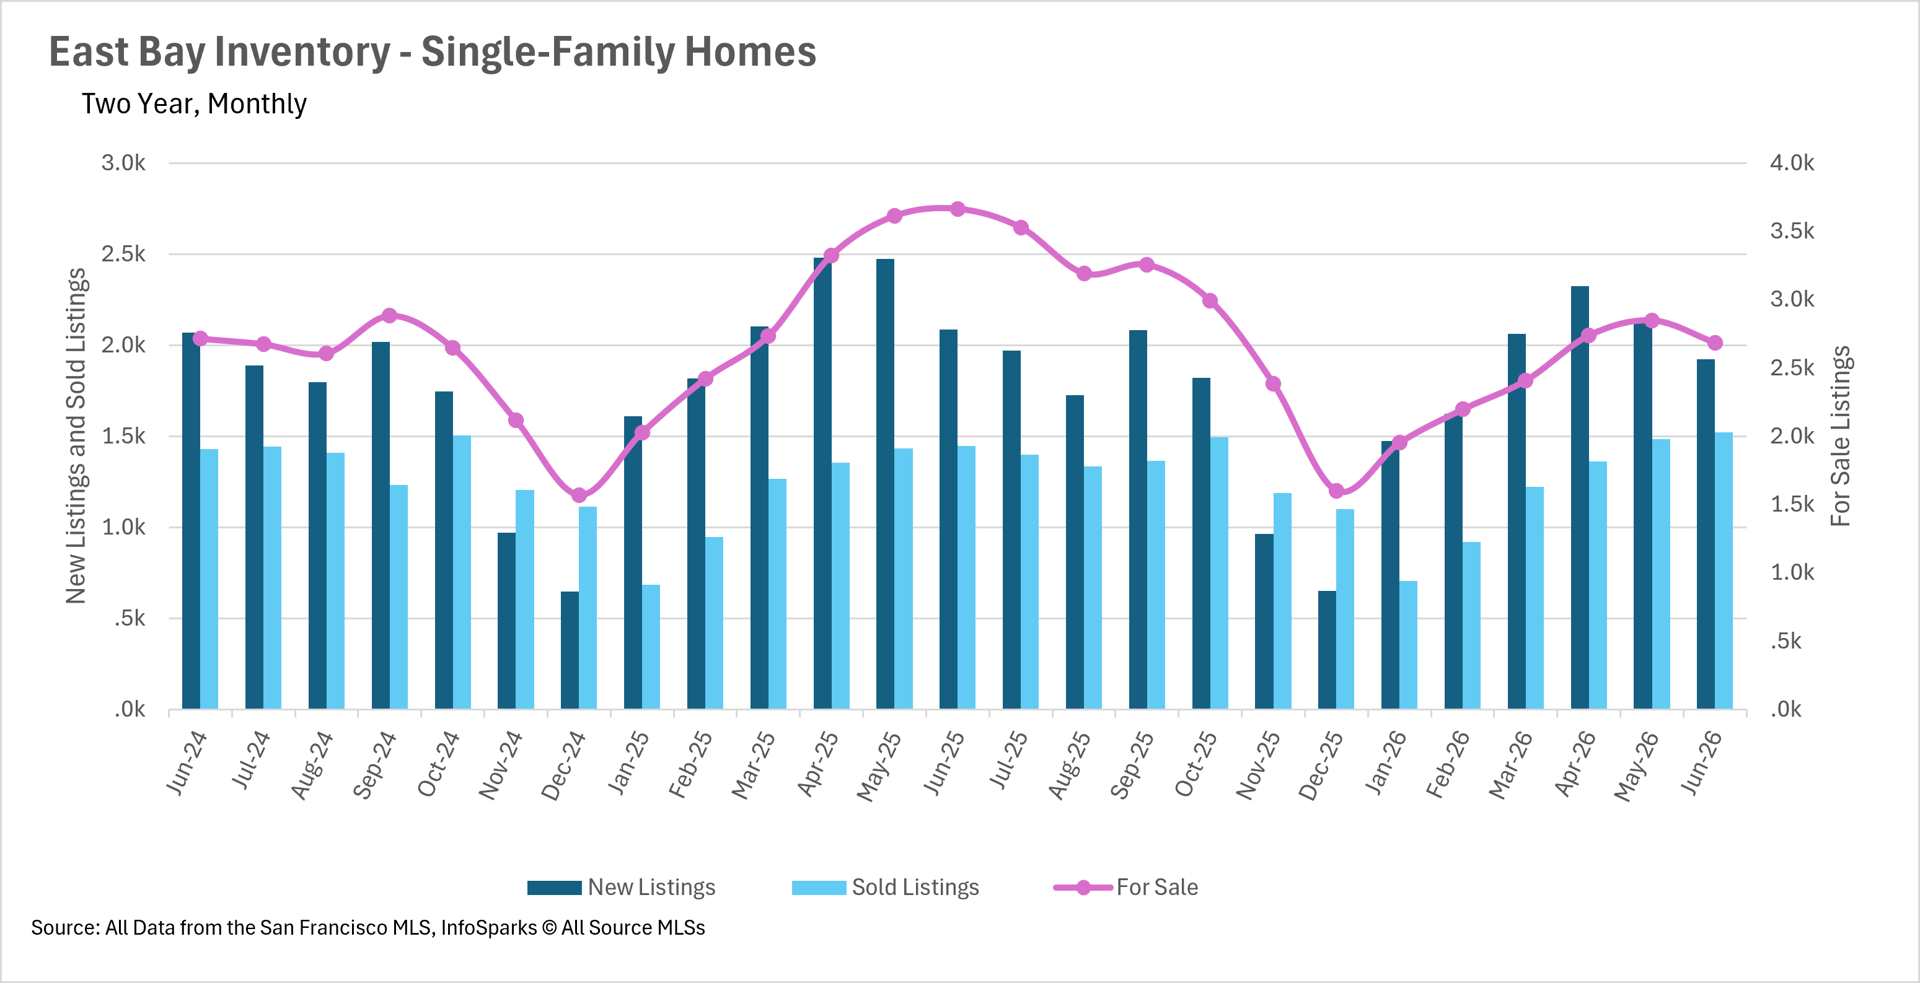
Despite the arrival of summer, inventory levels in the East Bay remain well below where they were a year ago. Single-family home inventory stood at just 2,684 units in June, representing a 26.79% decline on a year-over-year basis. The condo market saw a similar trend, with inventory down 10.36% year-over-year to 986 units. This persistent lack of supply continues to be the driving force behind the price appreciation we're seeing across both markets. With fewer homes to choose from, buyers are competing aggressively for available listings, which is pushing prices higher.
Single-family homes are moving considerably faster than last year
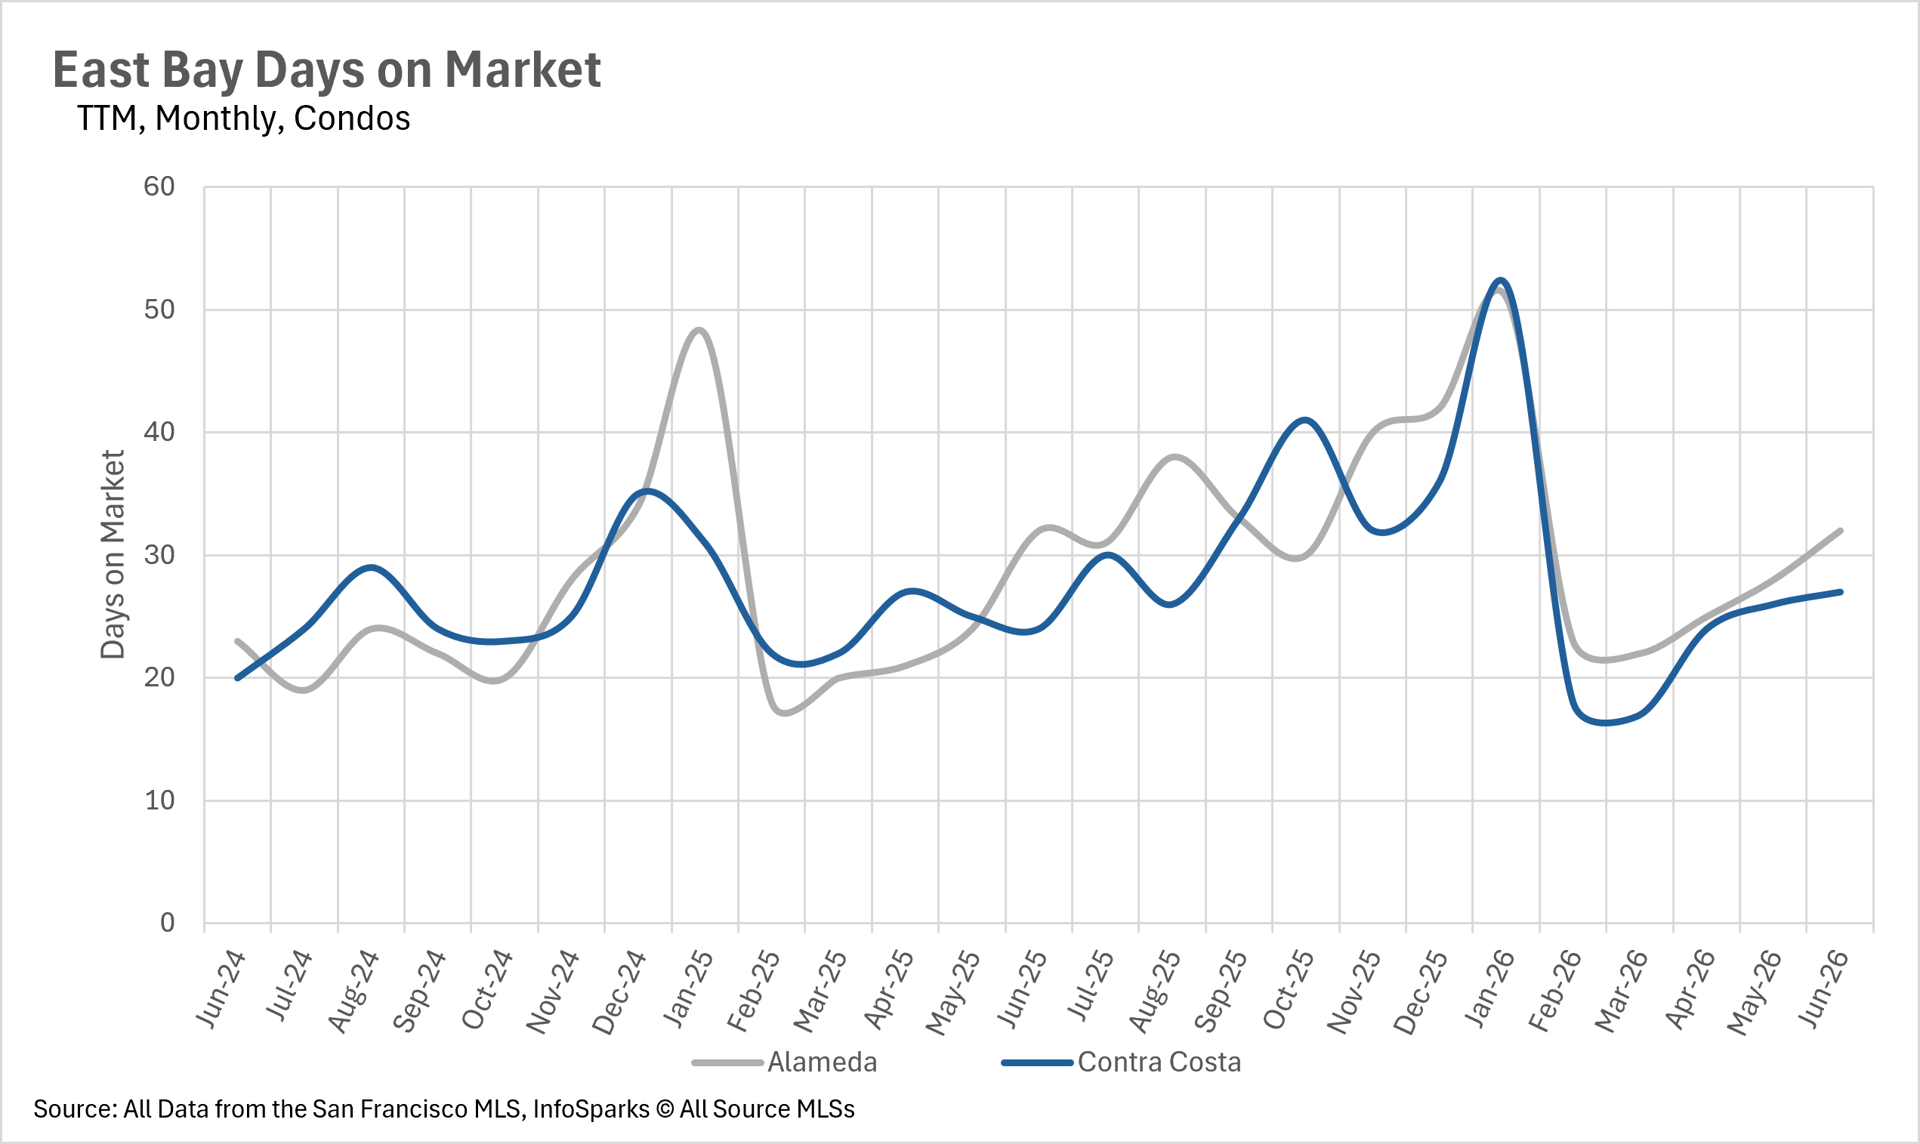
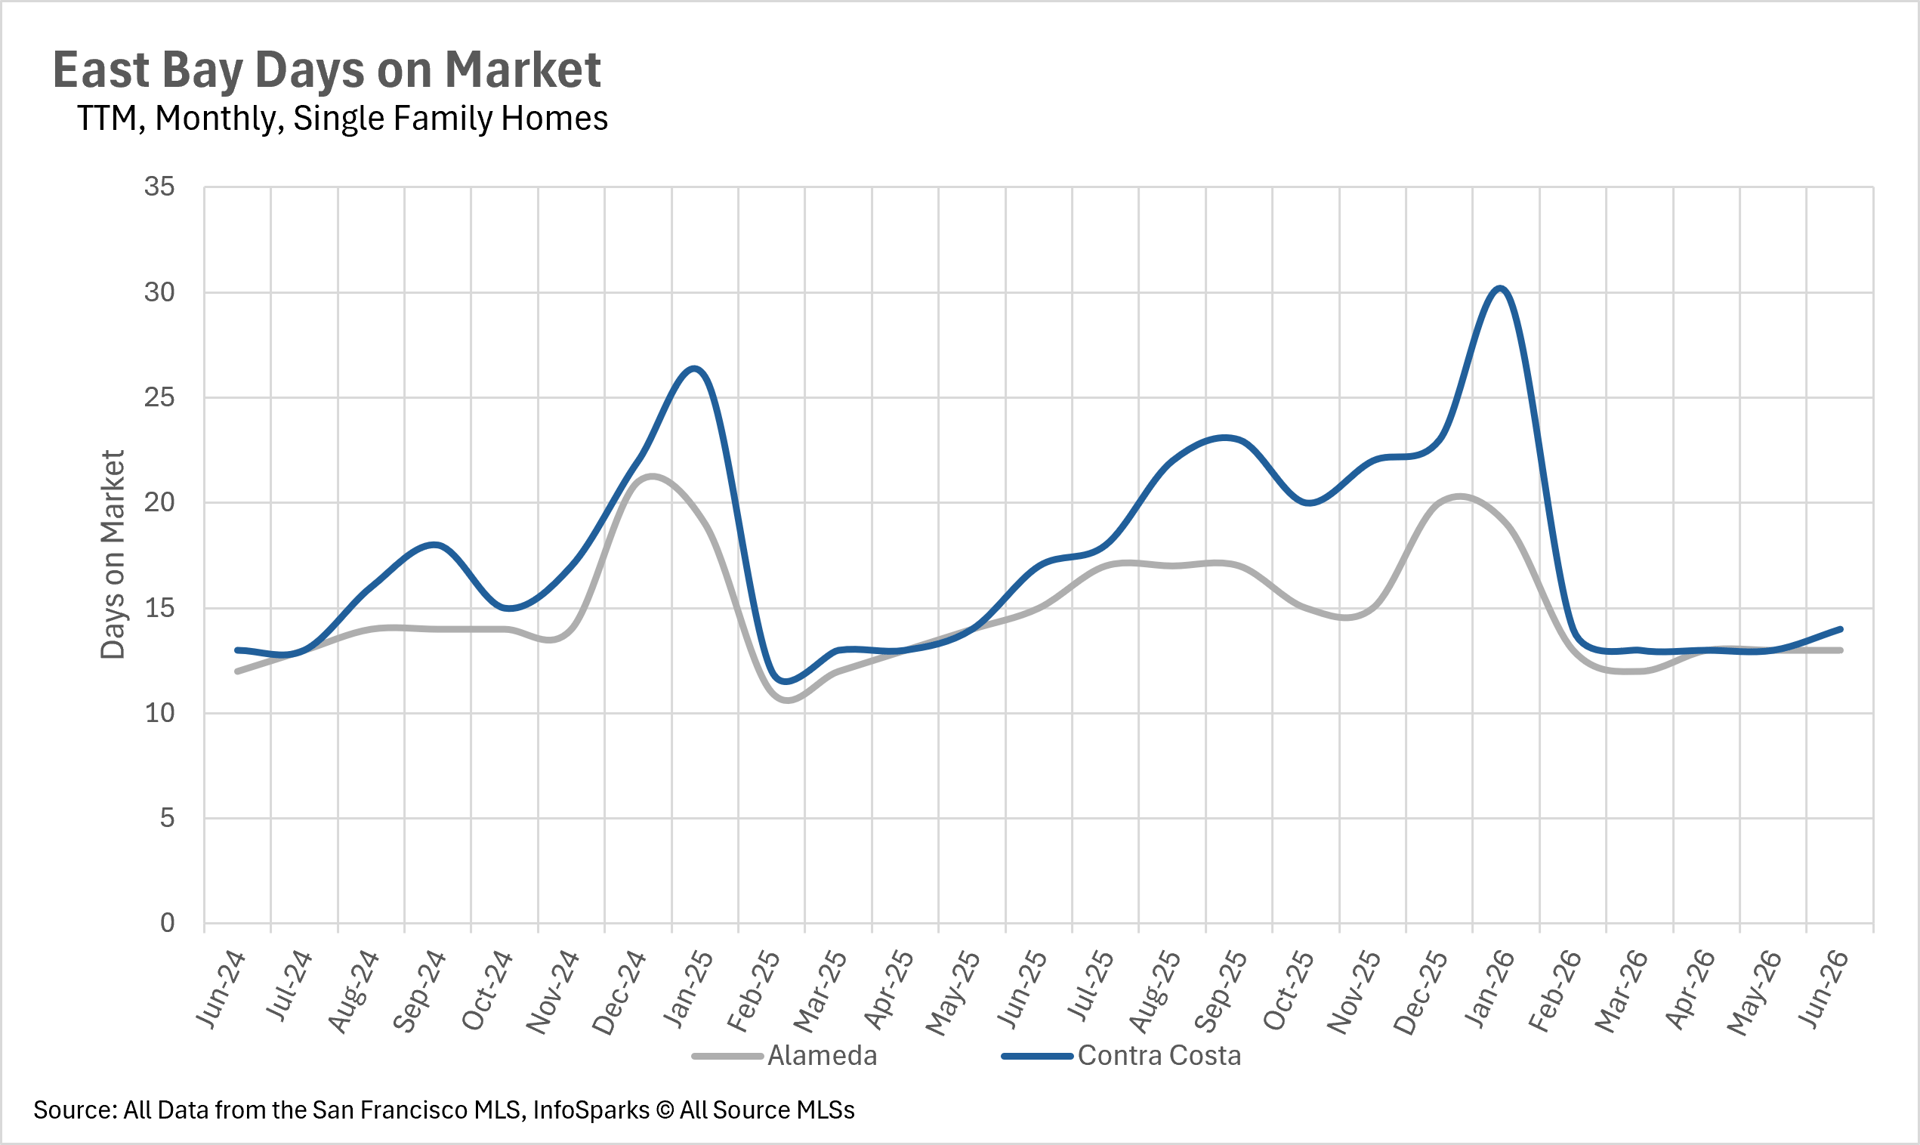
The tight inventory environment is pushing single-family homes to sell at an even faster clip than we saw a year ago. The average single-family home in Alameda County sold in just 13 days, representing a 13.33% improvement on a year-over-year basis. Contra Costa County saw an even bigger improvement, with the average listing selling in 14 days, a 17.65% year-over-year decline in days on market. The condo market is moving a bit more slowly, with the average condo in Alameda County spending 32 days on the market and Contra Costa County condos spending 27 days. While condos are taking longer to sell than single-family homes, they're still moving at a reasonable pace given broader market conditions.
Single-family homes remain a strong seller's market while condos favor buyers
When determining whether a market is a buyers' market or a sellers' market, we look to the Months of Supply Inventory (MSI) metric. The state of California has historically averaged around three months of MSI, so any area with at or around three months of MSI is considered a balanced market. Any market that has lower than three months of MSI is considered a seller's market, whereas markets with more than three months of MSI are considered buyers' markets.
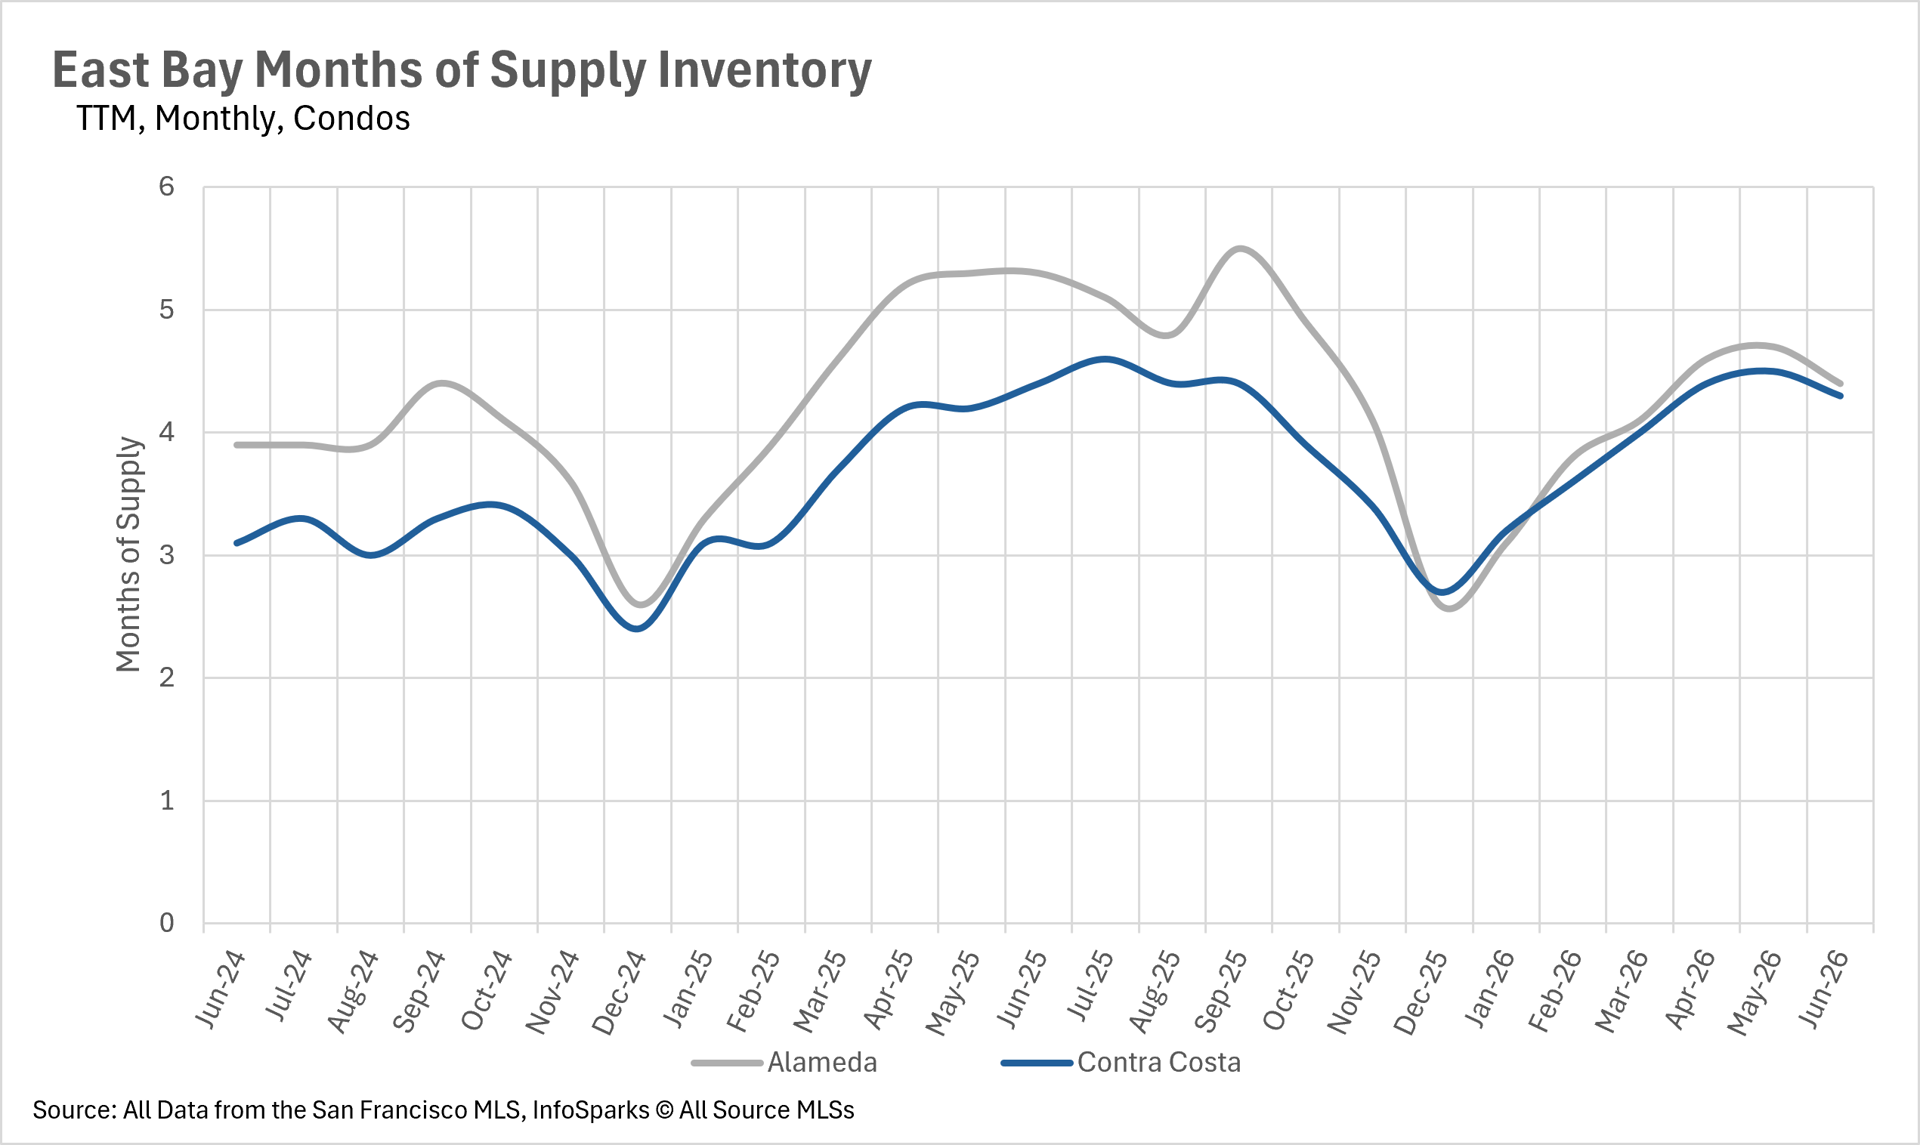
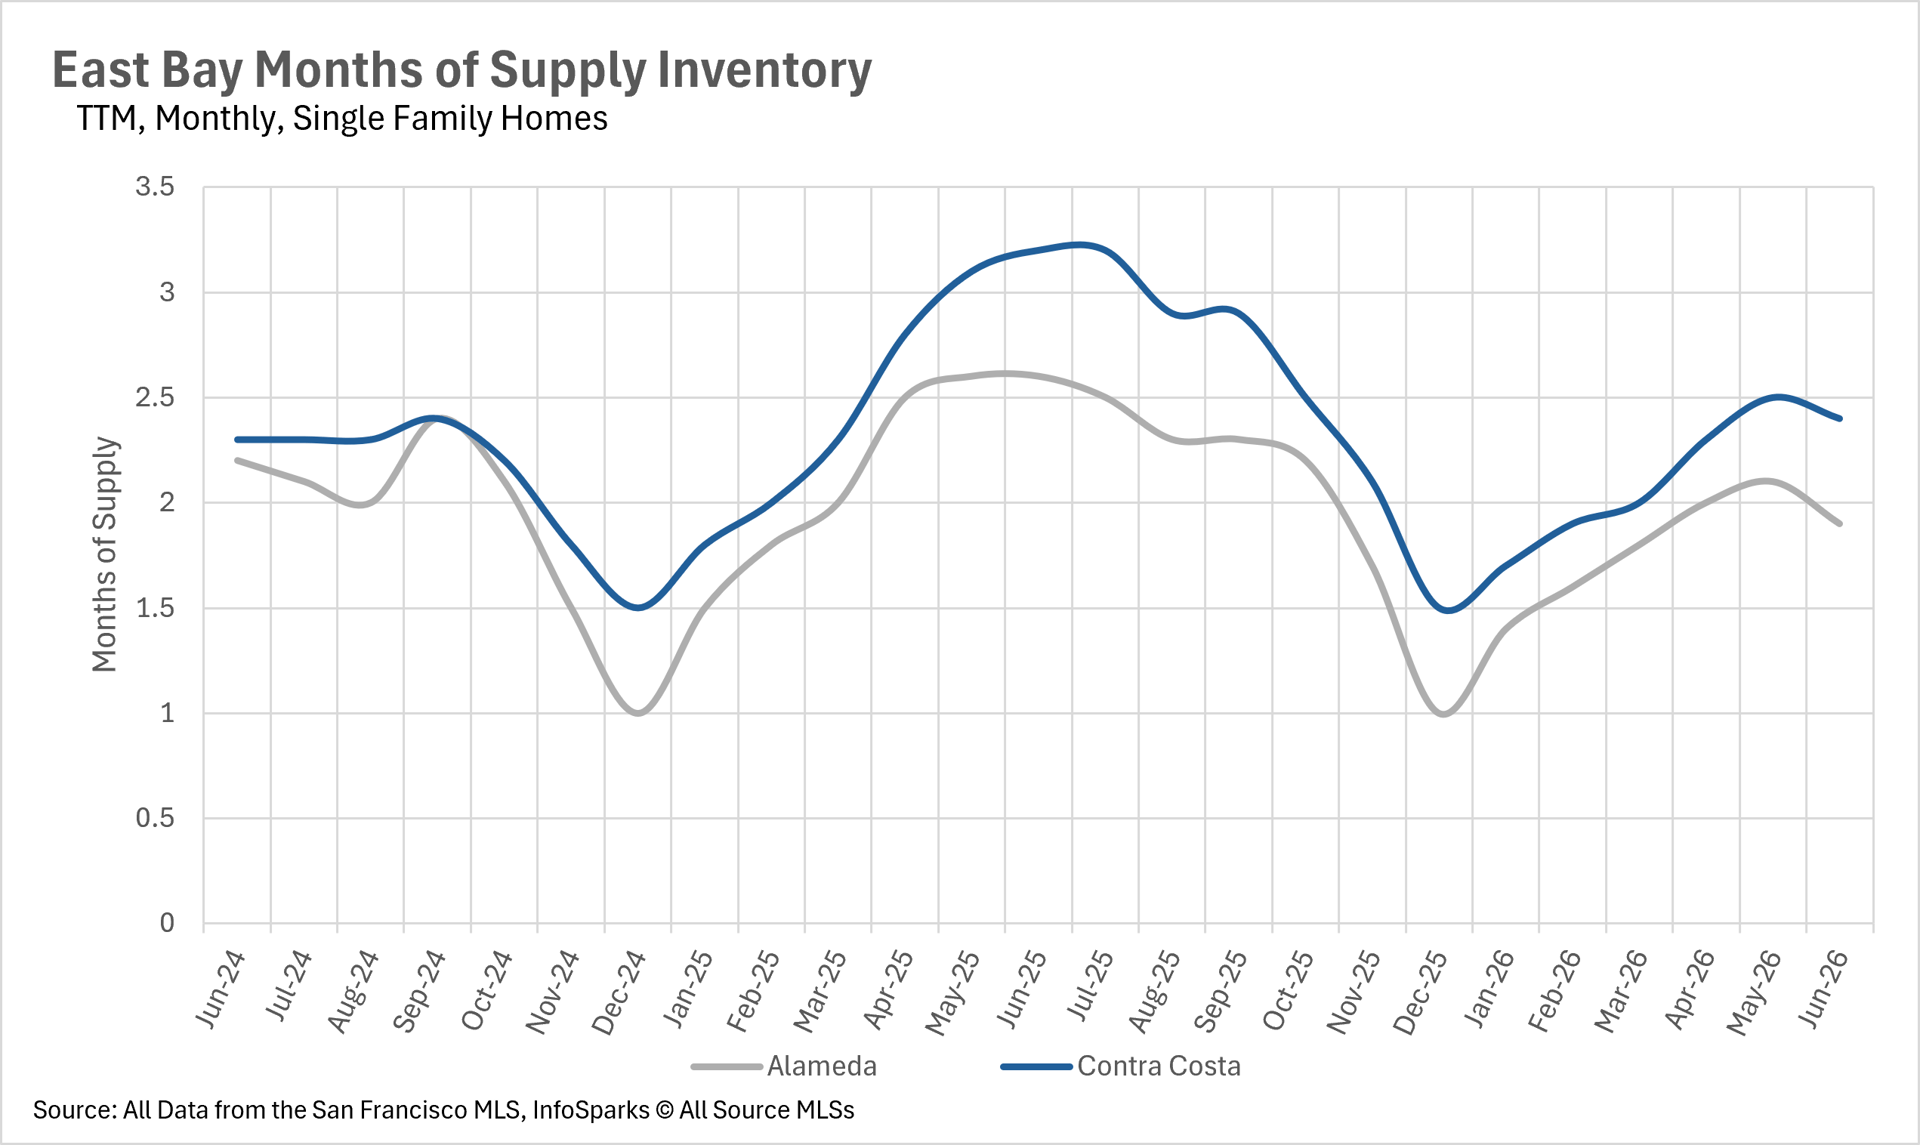
The single-family home market remains firmly in seller's market territory, with just 1.9 months of inventory in Alameda County and 2.4 months in Contra Costa County. These figures represent year-over-year declines of 26.92% and 25.00%, respectively, indicating that buyers continue to face stiff competition for available homes. The condo market remains in buyer's market territory, with Alameda County ending June with 4.4 months of inventory and Contra Costa County with 4.3 months. However, these figures have come down from their peaks earlier in the year, suggesting that the condo market is gradually tightening alongside the price appreciation we're seeing.
Local Lowdown Data